Fig. 7
Download original image
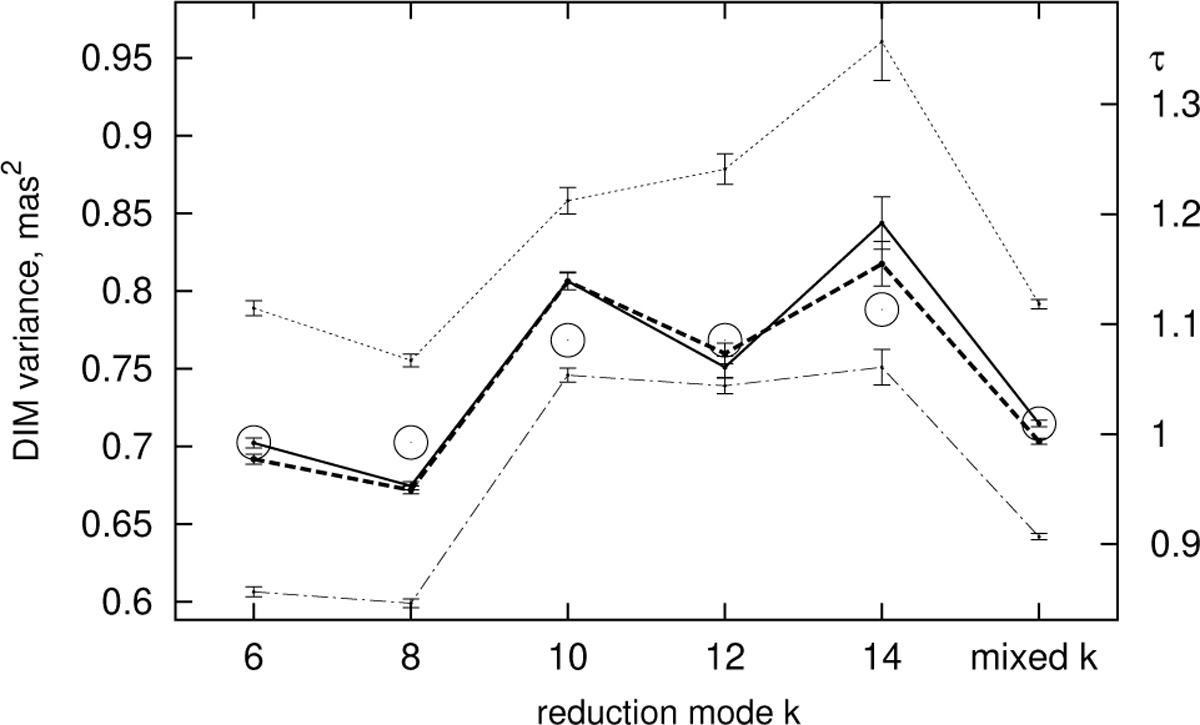
DIM variances AF(k) (solid) and ĀF(k) (dashed lines) derived from FORS2 astrometry at any seeing for each k (and k modes mixed); the variances τAc(k) derived from the model Eq. (24) at τ = 1.019 are shown by circles. Average of AF(k) and ĀF(k) for a good 0.4–0.6″ and worse 0.8–1.0″ seeing are shown by dash-dotted and dotted lines, respectively. The right axis τ is the ratio of DIM variances to A0 = 0.708 mas2 estimated with the model Eq. (21).
Current usage metrics show cumulative count of Article Views (full-text article views including HTML views, PDF and ePub downloads, according to the available data) and Abstracts Views on Vision4Press platform.
Data correspond to usage on the plateform after 2015. The current usage metrics is available 48-96 hours after online publication and is updated daily on week days.
Initial download of the metrics may take a while.