Fig. 6
Download original image
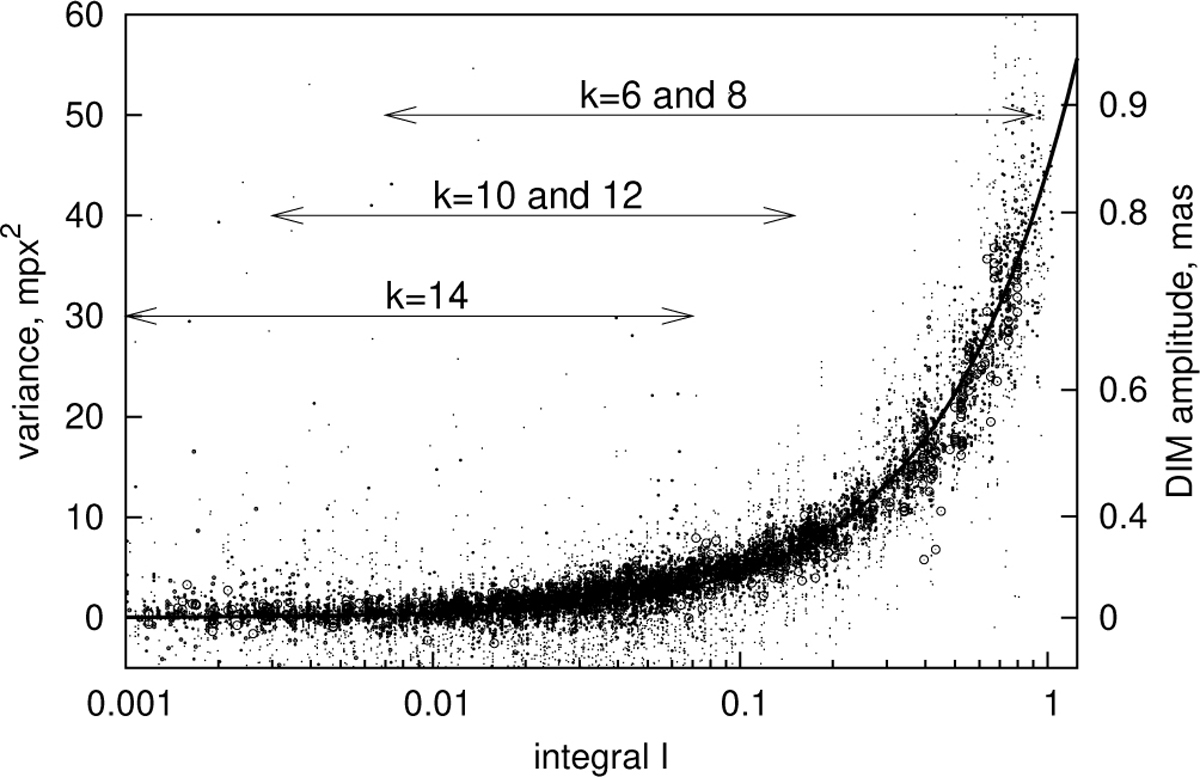
Measured variance ![]() at zenith for the 30 s exposure as a function of IF metric computed at href =18 km for all k modes mixed and a full data set (dot sizes show the star brightness). A linear Eq. (29) fit (solid line) visually coincides with the model dependence (21) based on the turbulence profile. Typical ranges of IF for each k are shown.
at zenith for the 30 s exposure as a function of IF metric computed at href =18 km for all k modes mixed and a full data set (dot sizes show the star brightness). A linear Eq. (29) fit (solid line) visually coincides with the model dependence (21) based on the turbulence profile. Typical ranges of IF for each k are shown.
Current usage metrics show cumulative count of Article Views (full-text article views including HTML views, PDF and ePub downloads, according to the available data) and Abstracts Views on Vision4Press platform.
Data correspond to usage on the plateform after 2015. The current usage metrics is available 48-96 hours after online publication and is updated daily on week days.
Initial download of the metrics may take a while.