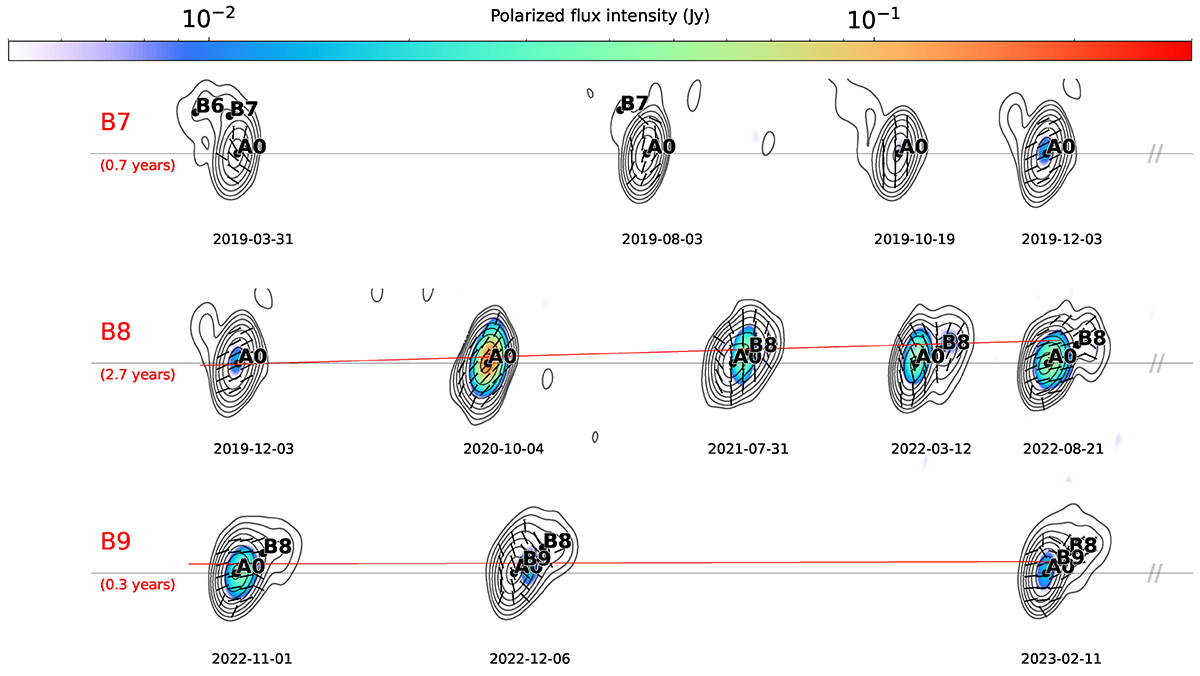
Fig. 5.
Download original image
Selected epochs illustrating the evolution of the last three identified components, B7, B8, and B9. The figure shows the total intensity (contours), polarized flux intensity (color sale), and polarization direction (black line segments). The horizontal black line marks the position of the core, A0. The red line in each row is a linear fit to the knot position, present for all except B7 due to its low flux. For each row, the spacing between plots is proportional to the elapsed time, with the total time indicated in parentheses. The full temporal evolution is available as an online movie.
Current usage metrics show cumulative count of Article Views (full-text article views including HTML views, PDF and ePub downloads, according to the available data) and Abstracts Views on Vision4Press platform.
Data correspond to usage on the plateform after 2015. The current usage metrics is available 48-96 hours after online publication and is updated daily on week days.
Initial download of the metrics may take a while.