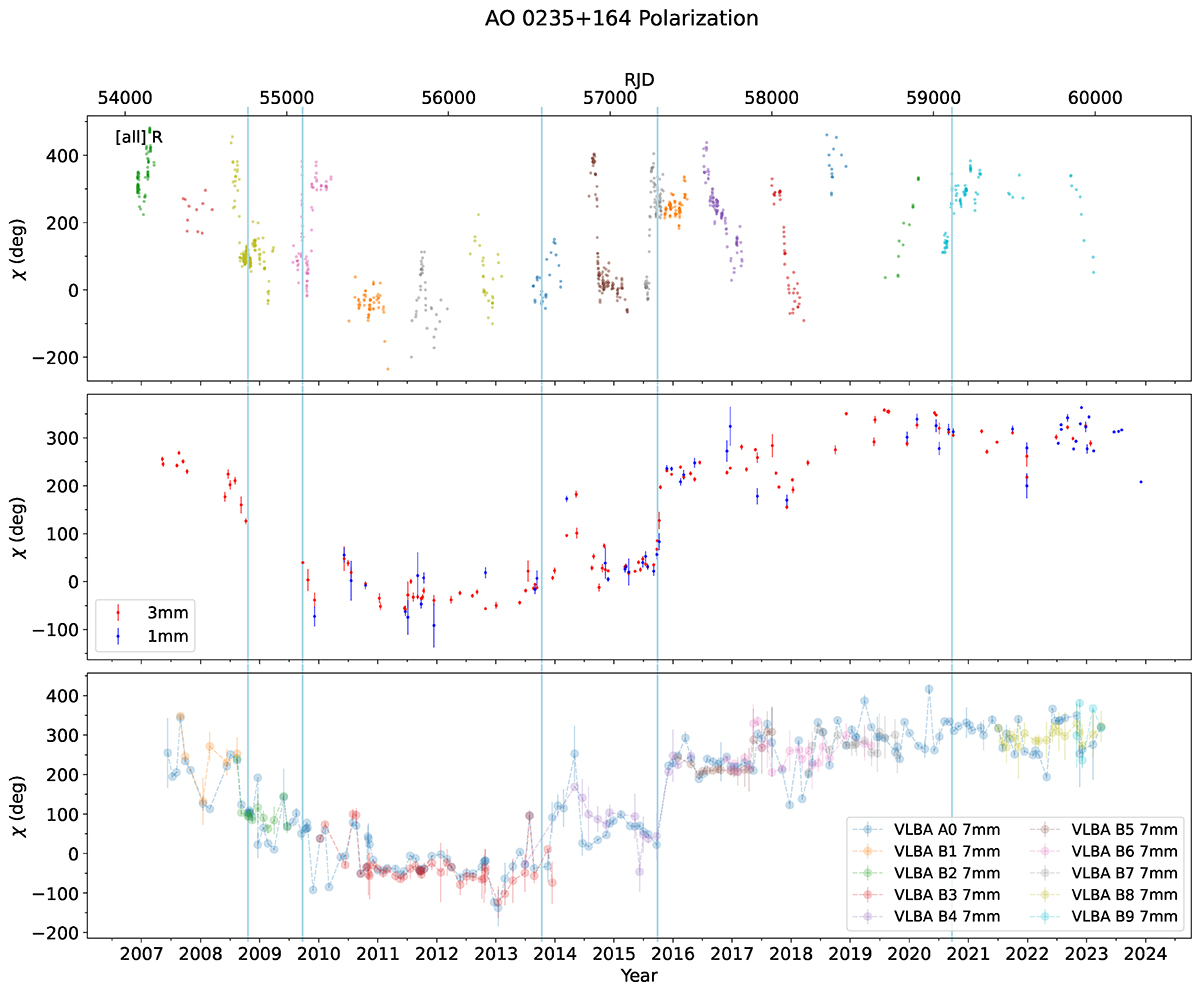
Fig. 4.
Download original image
Historical evolution of the polarization angle of AO 0235+164. Vertical lines correspond to the dates marked in Fig. 1. All points in the first panel correspond to the R band; the different colors denote the clusters that were shifted by n × 180° to follow the evolution of the polarization angle at 3mm, as discussed in Sect. 2.
Current usage metrics show cumulative count of Article Views (full-text article views including HTML views, PDF and ePub downloads, according to the available data) and Abstracts Views on Vision4Press platform.
Data correspond to usage on the plateform after 2015. The current usage metrics is available 48-96 hours after online publication and is updated daily on week days.
Initial download of the metrics may take a while.