Open Access
Fig. 13.
Download original image
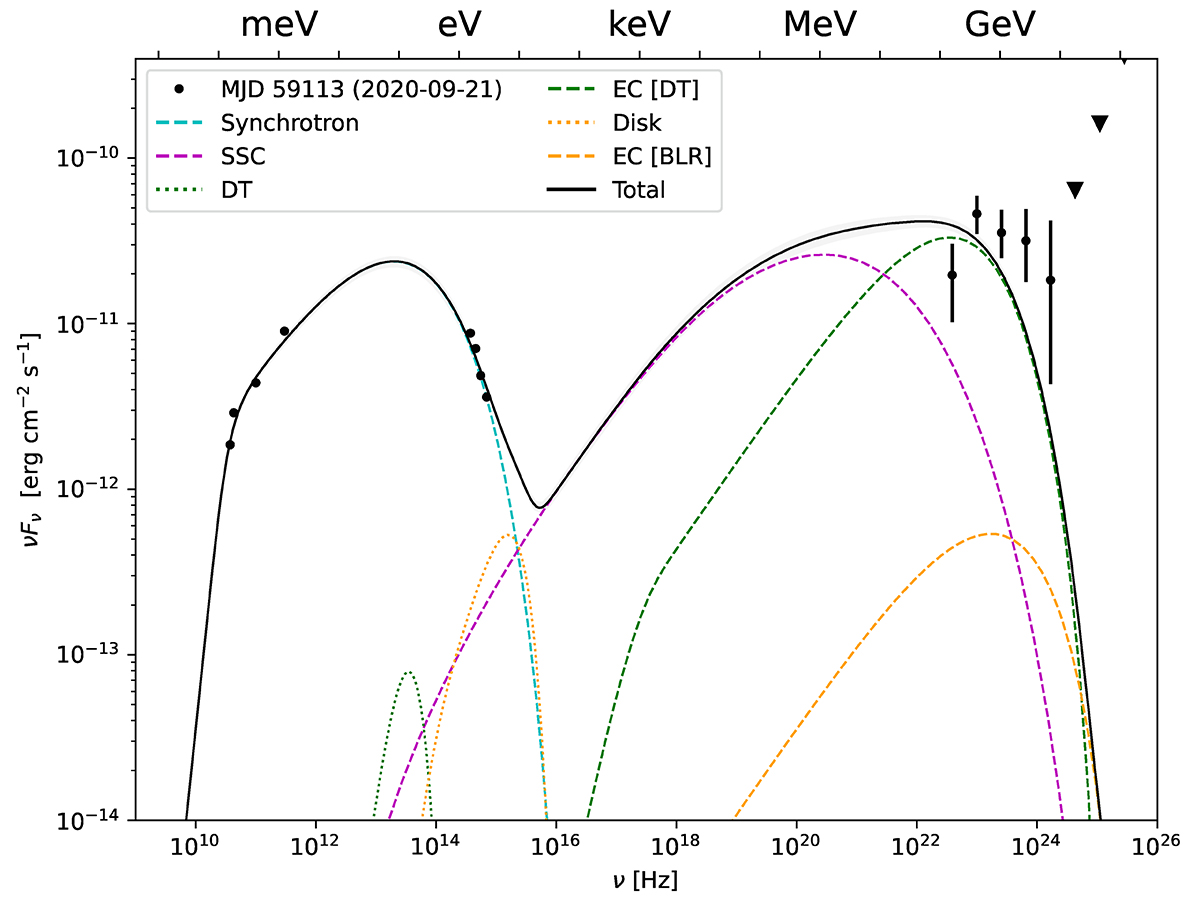
Spectral energy distribution from September 21, 2023, together with the best fit of the SSC+EC model with fixed Γ and θ as discussed in Section 3.6. The gray area represents the 3σ uncertainty region. The downward pointing triangles represent upper limits.
Current usage metrics show cumulative count of Article Views (full-text article views including HTML views, PDF and ePub downloads, according to the available data) and Abstracts Views on Vision4Press platform.
Data correspond to usage on the plateform after 2015. The current usage metrics is available 48-96 hours after online publication and is updated daily on week days.
Initial download of the metrics may take a while.