Fig. 10.
Download original image
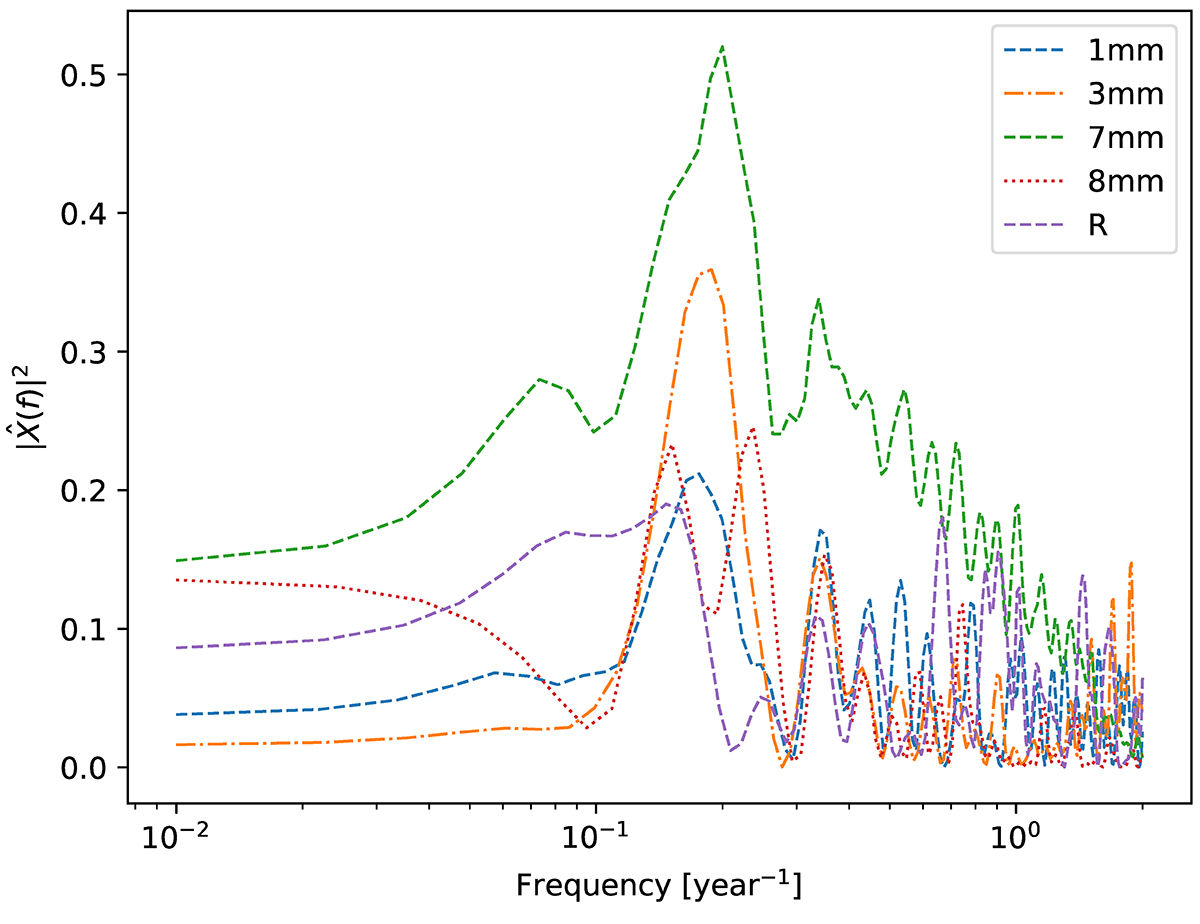
Normalized PSD computed using the Lomb-Scargle periodogram for the 1mm, 3mm, 7mm, 8mm, and R light curves, showing peak frequencies corresponding to characteristic timescales of 5.7, 5.4, 5.1, 4.2, and 6.8 years, respectively. These timescales are mostly in agreement with the 5–8 year timescale found in previous works. The false alarm probability in all cases is close to zero (≪0.1%), meaning that there is a very low probability that such a peak would be caused by a pure noise signal.
Current usage metrics show cumulative count of Article Views (full-text article views including HTML views, PDF and ePub downloads, according to the available data) and Abstracts Views on Vision4Press platform.
Data correspond to usage on the plateform after 2015. The current usage metrics is available 48-96 hours after online publication and is updated daily on week days.
Initial download of the metrics may take a while.