Fig. 7
Download original image
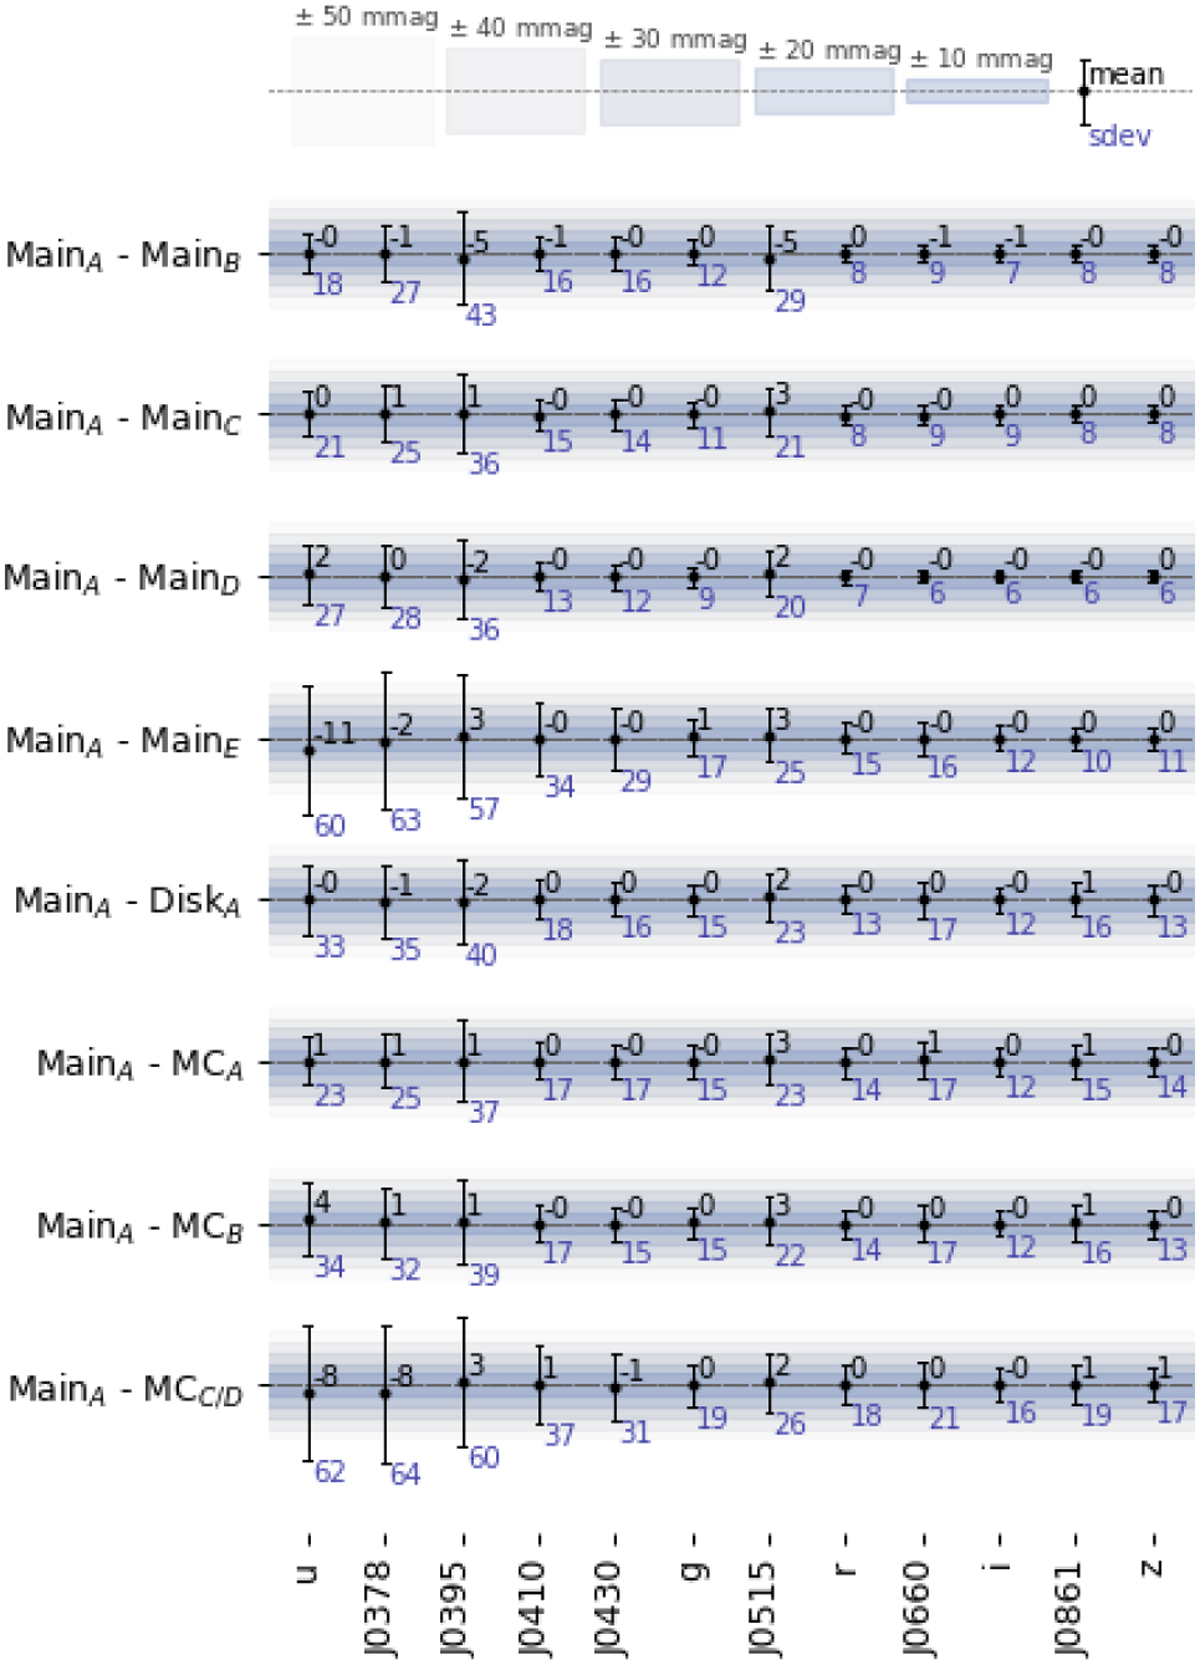
Average differences between the ZP for the MainA and each strategy applied in 151 fields in the STRIPE82 region, for each of the 12 filters. The mean values for each distribution are shown in black near each data point. The error bar represents the standard deviation of the distribution, which is also listed in the blue text below each bar. Both sets or values are in mmag.
Current usage metrics show cumulative count of Article Views (full-text article views including HTML views, PDF and ePub downloads, according to the available data) and Abstracts Views on Vision4Press platform.
Data correspond to usage on the plateform after 2015. The current usage metrics is available 48-96 hours after online publication and is updated daily on week days.
Initial download of the metrics may take a while.