Fig. 4
Download original image
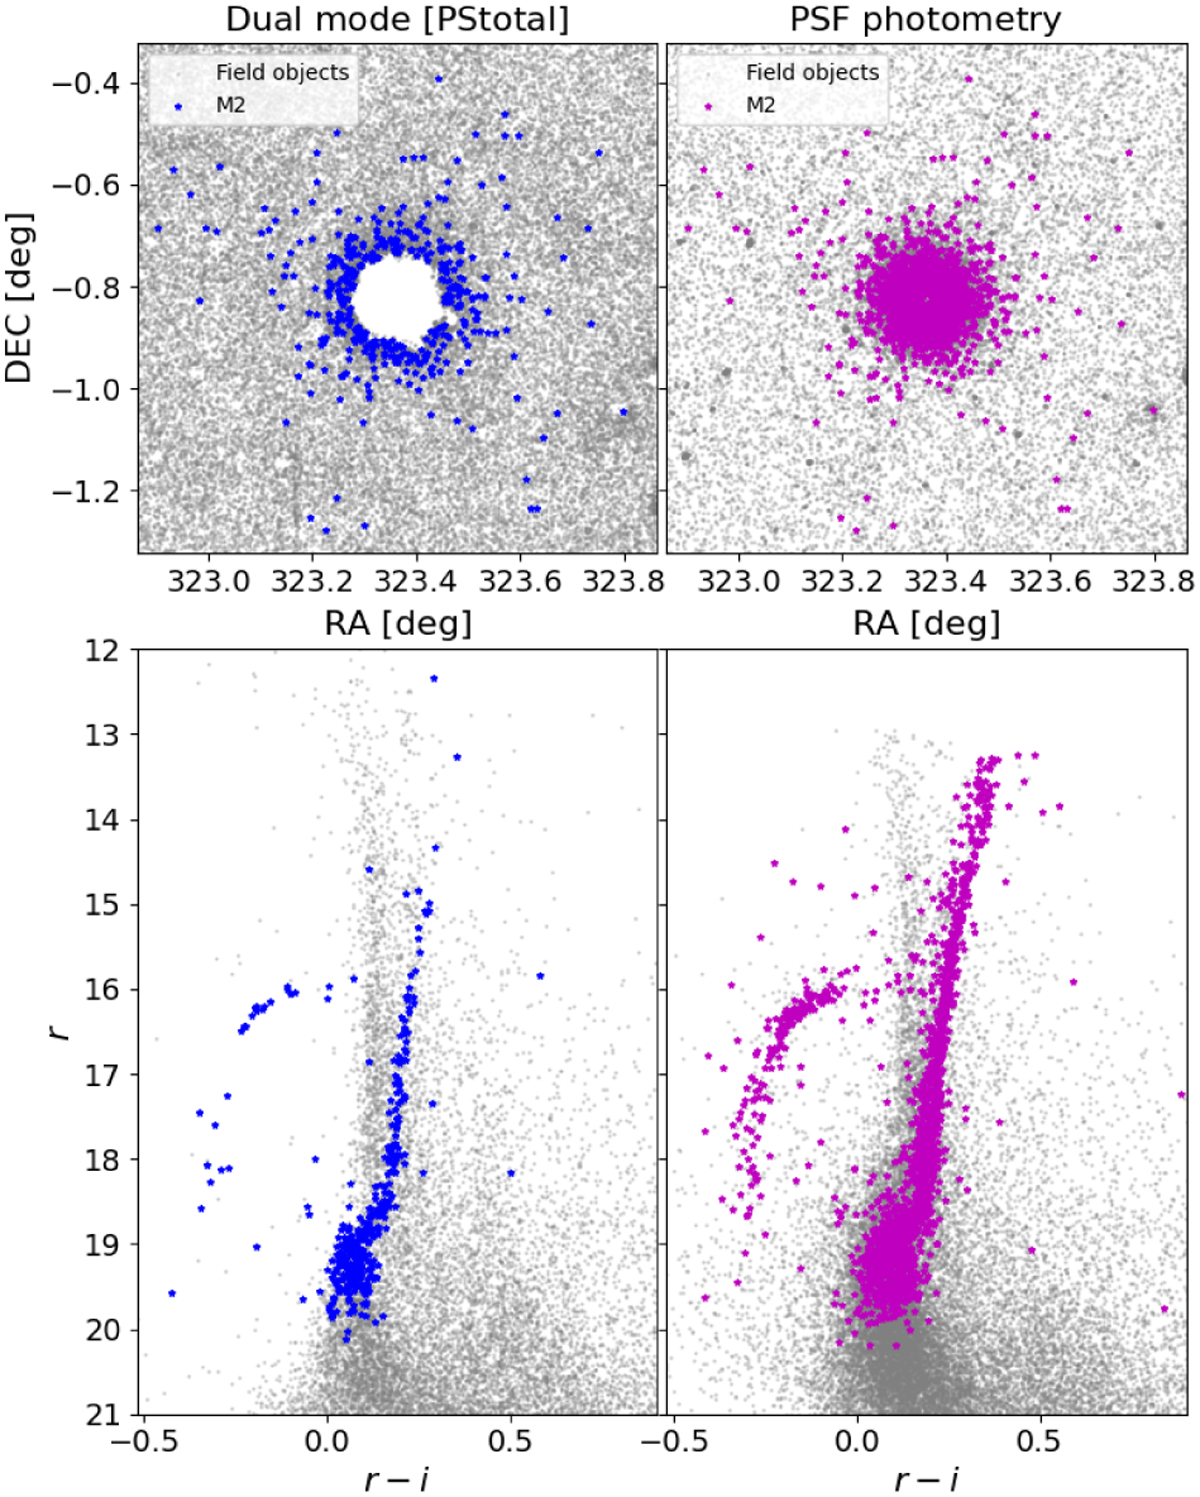
Comparison between PSF and aperture photometry in S-PLUS DR4. Top panels represent the spatial distribution of sources, while the bottom panels are colour-magnitude diagrams of the M2 globular cluster in the S-PLUS STRIPE82-0119 field. The blue points represent the sources detected using aperture photometry in the dual mode, and the magenta points are the ones obtained with the PSF photometry. Background grey dots are field detections for the respective photometric mode.
Current usage metrics show cumulative count of Article Views (full-text article views including HTML views, PDF and ePub downloads, according to the available data) and Abstracts Views on Vision4Press platform.
Data correspond to usage on the plateform after 2015. The current usage metrics is available 48-96 hours after online publication and is updated daily on week days.
Initial download of the metrics may take a while.