Fig. 3
Download original image
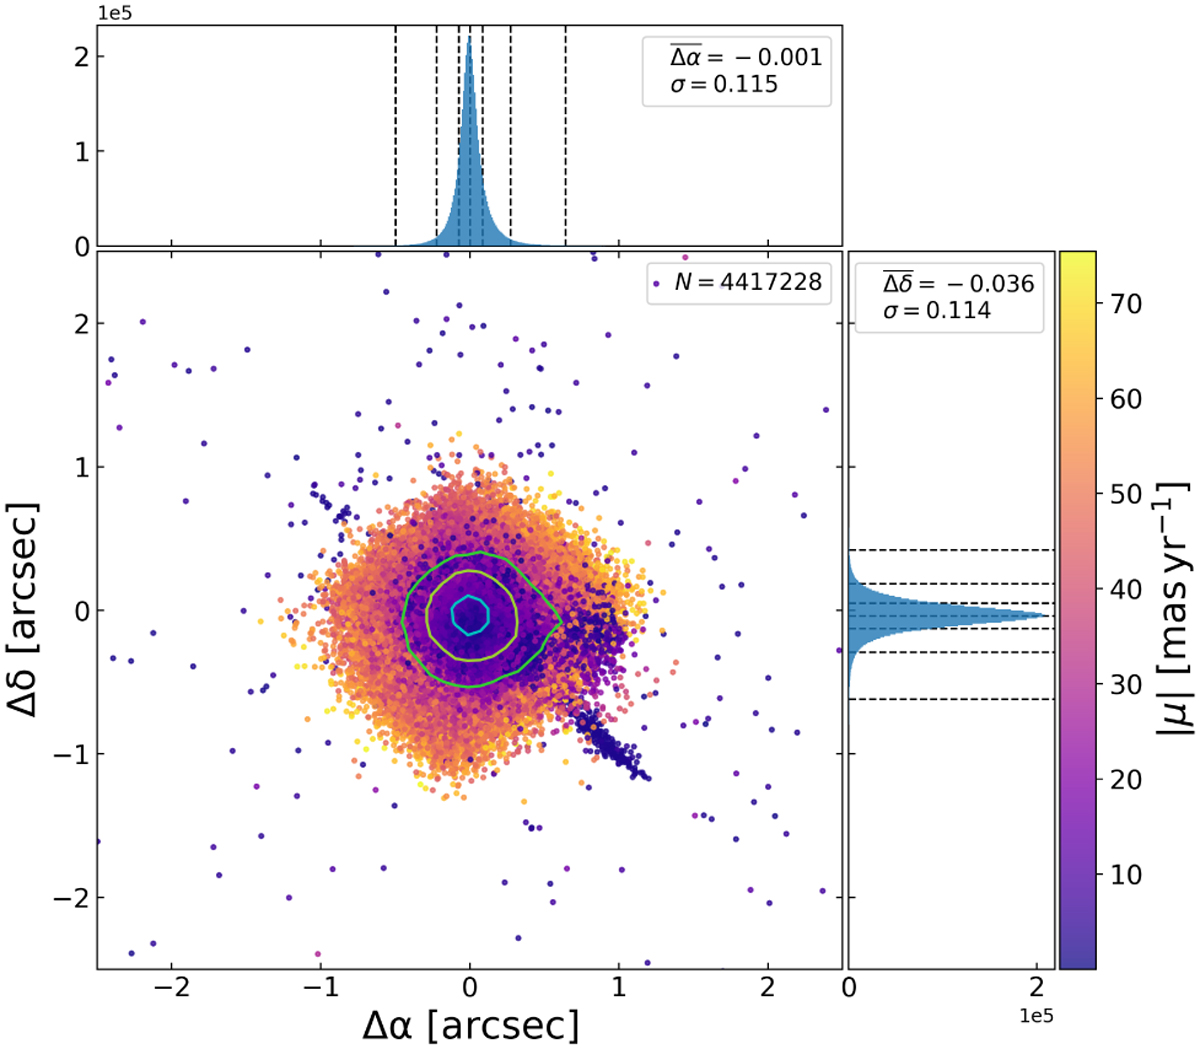
Astrometric precision of the DR4 PSF data compared to Gaia coordinates of over 4 million sources. Main panel: distribution of the sources colour-codded by the absolute value of the proper motion |µ| obtained from the Gaia data. The contours represent 1σ (cyan), 2σ (yellow), and 3σ (green) of the distribution. The histograms show the respective distributions for each axis with the dashed lines corresponding to 1σ, 2σ, and 3σ. The histogram labels show the respective distribution’s median and σ.
Current usage metrics show cumulative count of Article Views (full-text article views including HTML views, PDF and ePub downloads, according to the available data) and Abstracts Views on Vision4Press platform.
Data correspond to usage on the plateform after 2015. The current usage metrics is available 48-96 hours after online publication and is updated daily on week days.
Initial download of the metrics may take a while.