Fig. 14
Download original image
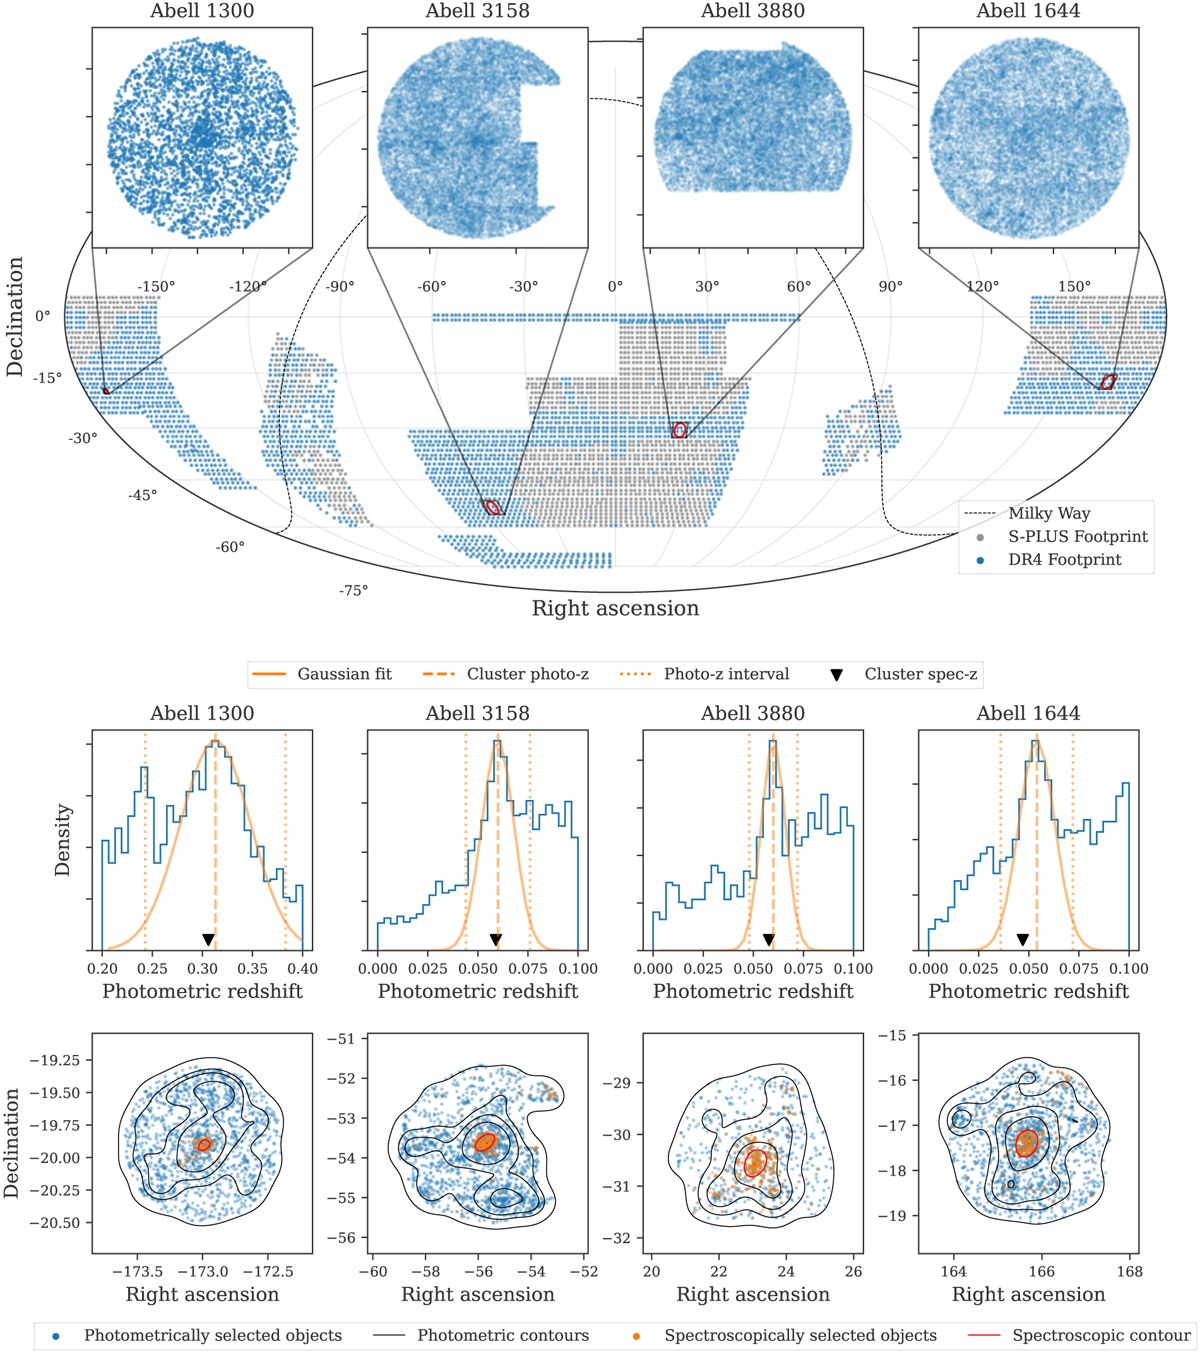
Identification of cluster membership with S-PLUS photometric redshifts. The top row contains the sky projection of the S-PLUS data galaxies (PROB_GAL ≥ 0.5) obtained from a cone-search centred in the cluster coordinates. The middle row contains the photometric redshift distribution for these clusters, and the bottom row shows the objects selected based on a cut on photometric redshifts.
Current usage metrics show cumulative count of Article Views (full-text article views including HTML views, PDF and ePub downloads, according to the available data) and Abstracts Views on Vision4Press platform.
Data correspond to usage on the plateform after 2015. The current usage metrics is available 48-96 hours after online publication and is updated daily on week days.
Initial download of the metrics may take a while.