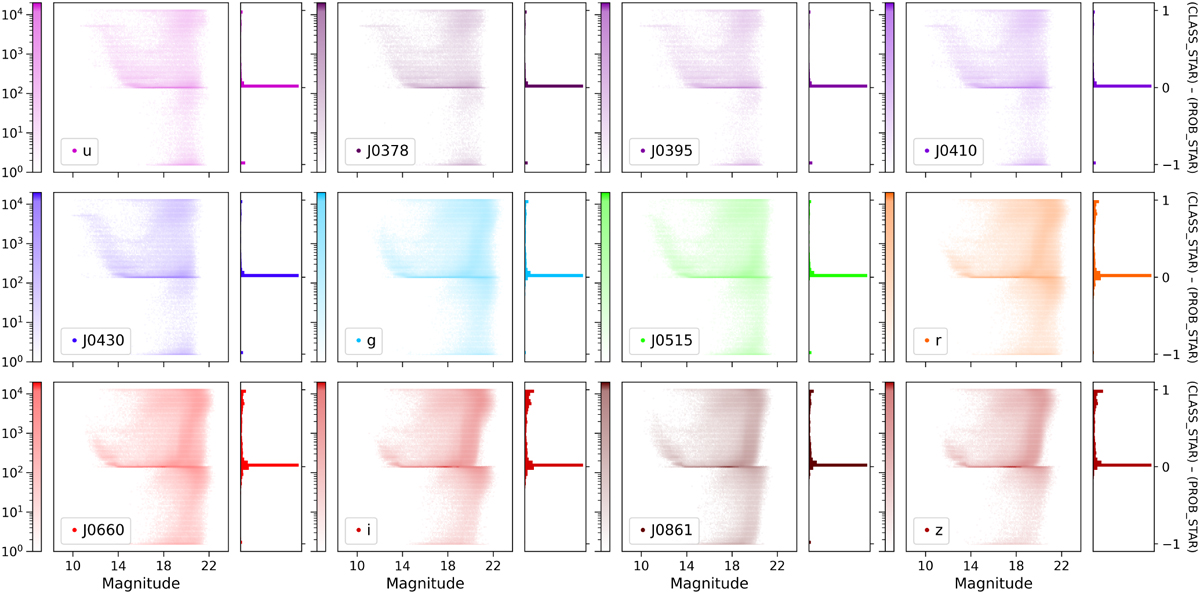
Fig. 12
Download original image
Consistency between the classification from the PSF photometry catalogue (CLASS_STAR) and the probability of the source being a star from the star-galaxy-quasar classification VAC (PROB_STAR) for each filter in the STRIPE82 region. The scatter plots correspond to the difference between the two classifications as a function of the magnitude, coloured by the logarithmic density of points. The correspondent histograms are normalized.
Current usage metrics show cumulative count of Article Views (full-text article views including HTML views, PDF and ePub downloads, according to the available data) and Abstracts Views on Vision4Press platform.
Data correspond to usage on the plateform after 2015. The current usage metrics is available 48-96 hours after online publication and is updated daily on week days.
Initial download of the metrics may take a while.