Fig. 9.
Download original image
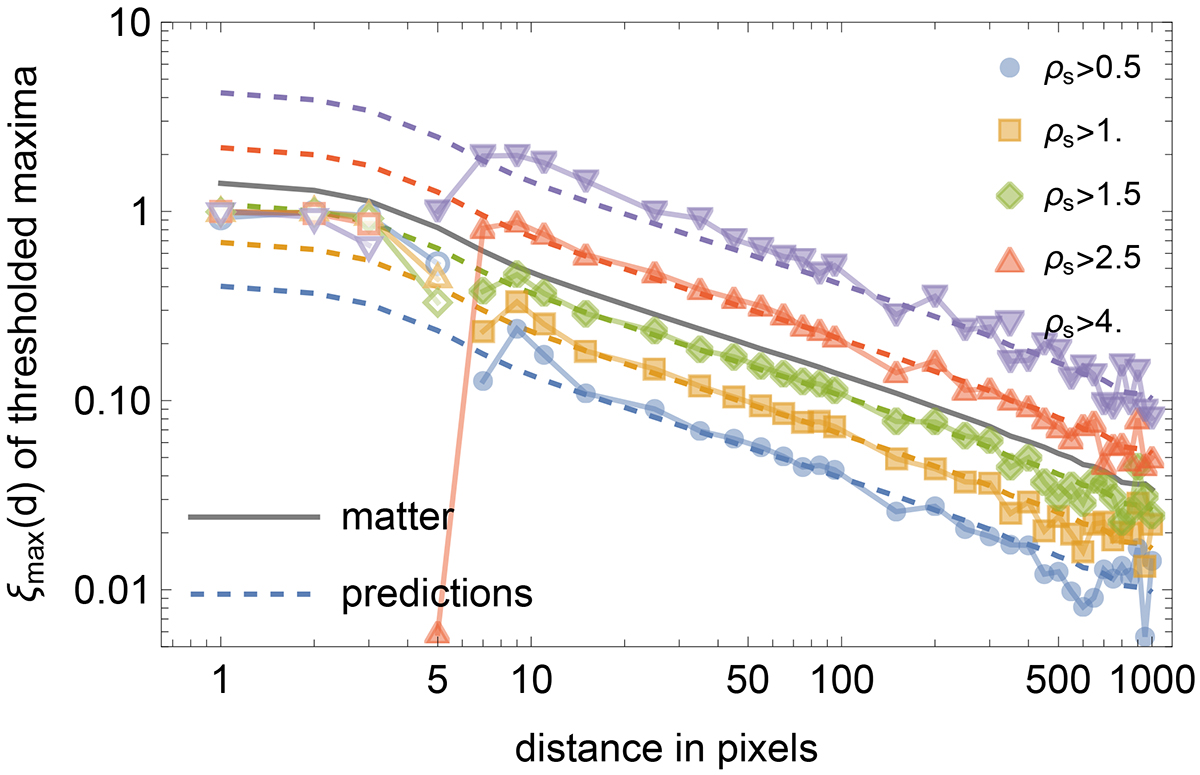
Same as previous figure for the thresholded maxima. Open symbols correspond to negative values. We see a sharp transition between the large-scale behaviour – well predicted by the theory – and the small-scale behaviour. Note: the plateau at small scale corresponds to ξmax(d) = − 1, meaning that peaks generate an exclusion zone in their vicinity.
Current usage metrics show cumulative count of Article Views (full-text article views including HTML views, PDF and ePub downloads, according to the available data) and Abstracts Views on Vision4Press platform.
Data correspond to usage on the plateform after 2015. The current usage metrics is available 48-96 hours after online publication and is updated daily on week days.
Initial download of the metrics may take a while.