Fig. 8.
Download original image
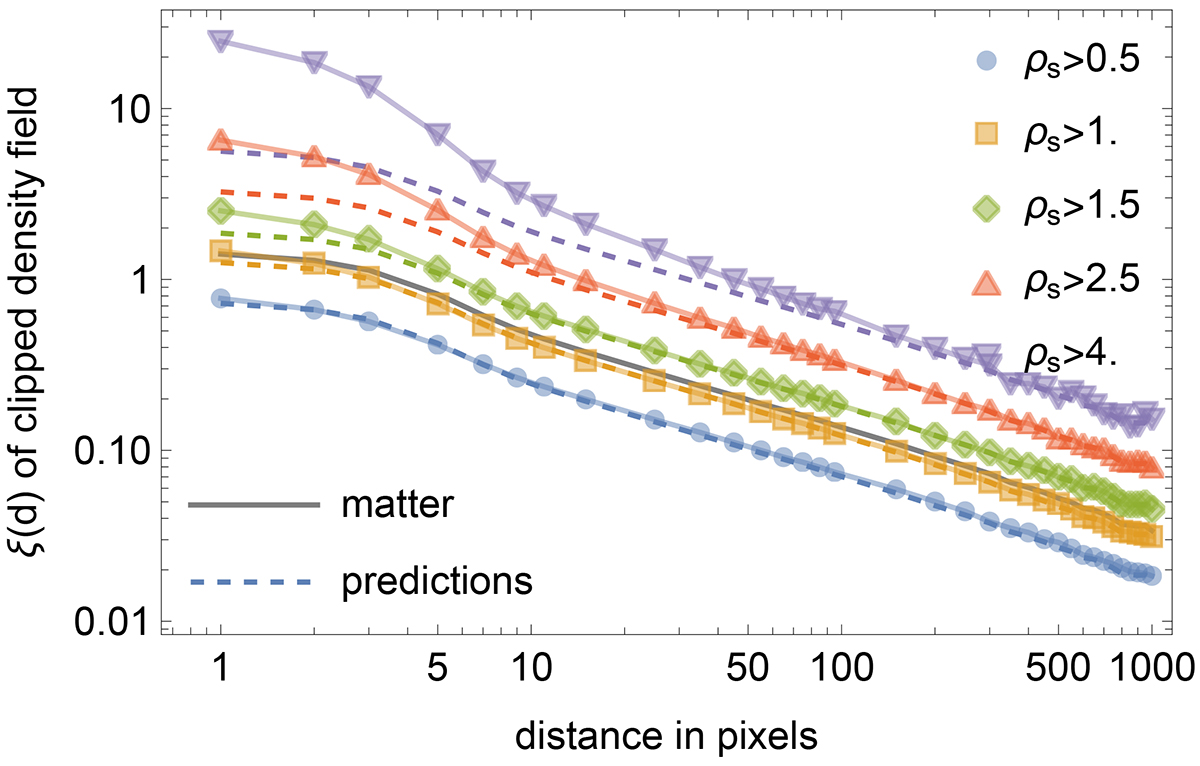
Correlation function of the thresholded density regions and comparisons with predictions. The black solid line is the measured matter correlation function. The dashed lines are the prediction correlation amplitudes for thresholded regions derived from their large-scale limit. They have been computed after applying bias factors b#(> ρs)2 to ξ0(d) as measured in the simulation.
Current usage metrics show cumulative count of Article Views (full-text article views including HTML views, PDF and ePub downloads, according to the available data) and Abstracts Views on Vision4Press platform.
Data correspond to usage on the plateform after 2015. The current usage metrics is available 48-96 hours after online publication and is updated daily on week days.
Initial download of the metrics may take a while.