Fig. 3.
Download original image
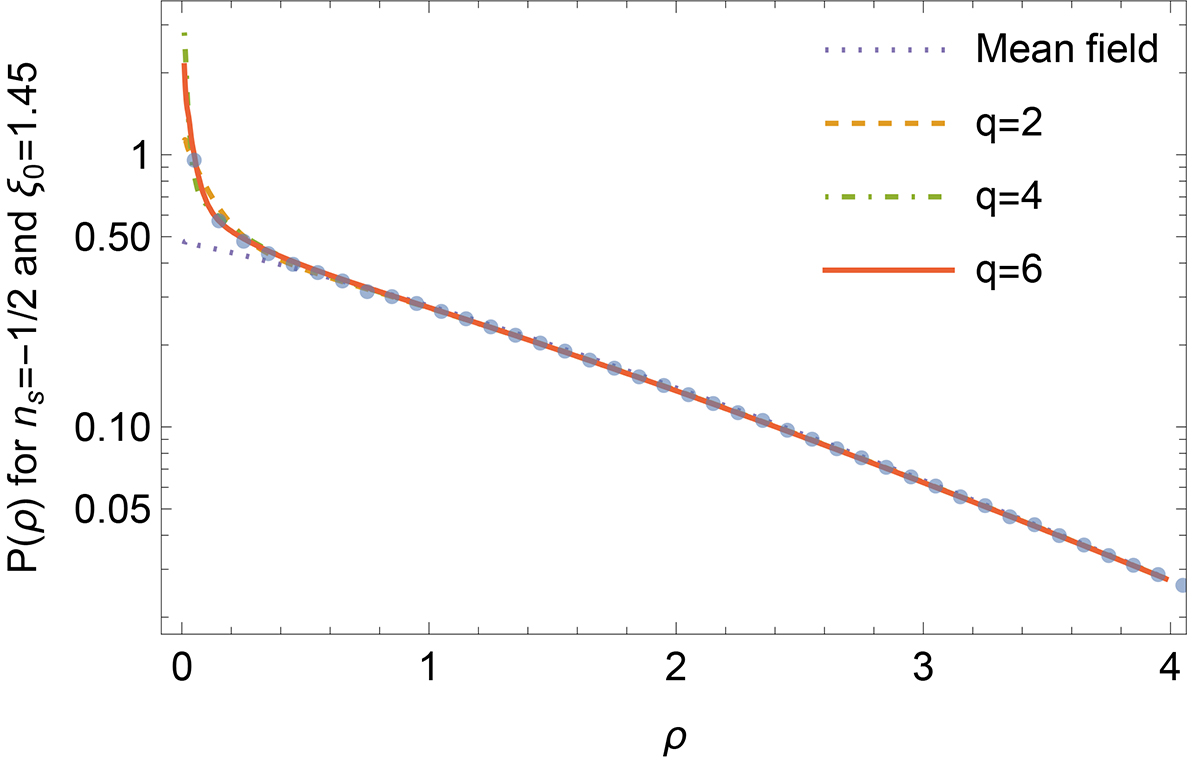
Comparisons of measured density PDF from a set of 1D Rayleigh-Levy flights whose characteristics are given in the text, grey points, compared to different levels of theoretical predictions. The blue dotted line is the mean field approximation. The other lines correspond to different level of approximation, up to sixth order in an expansion in Hermite Polynomials.
Current usage metrics show cumulative count of Article Views (full-text article views including HTML views, PDF and ePub downloads, according to the available data) and Abstracts Views on Vision4Press platform.
Data correspond to usage on the plateform after 2015. The current usage metrics is available 48-96 hours after online publication and is updated daily on week days.
Initial download of the metrics may take a while.