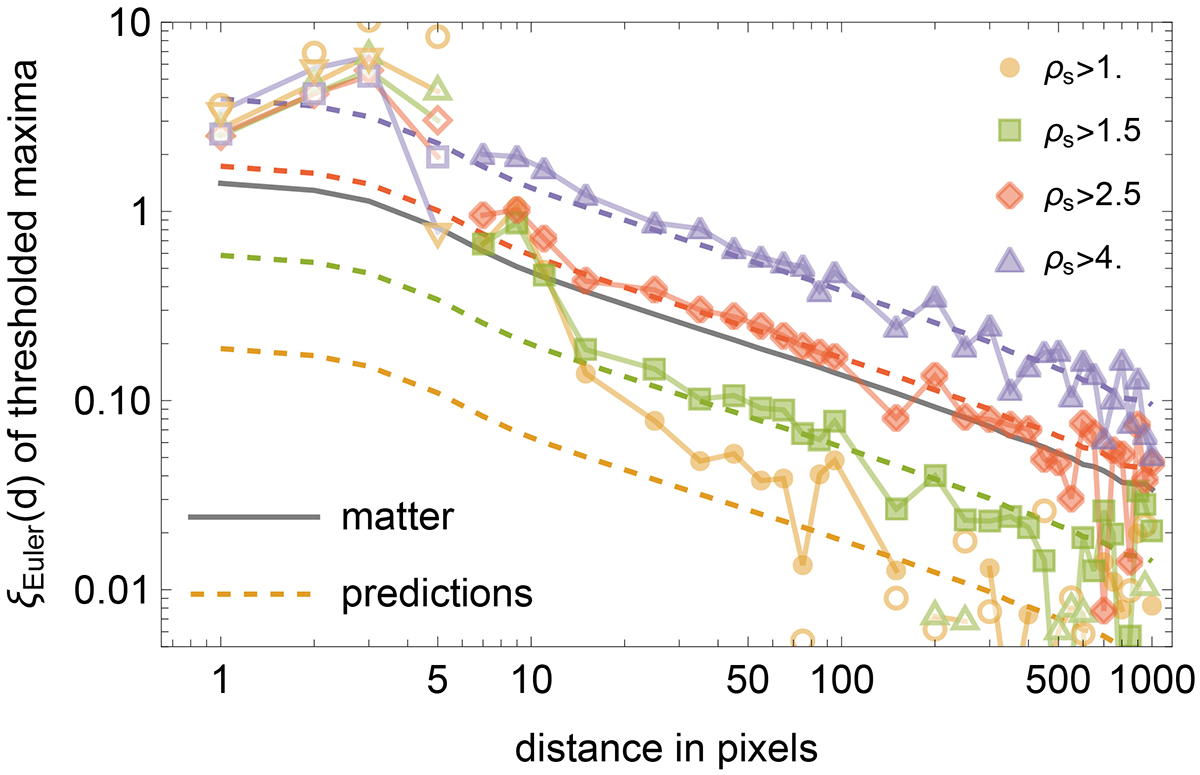
Fig. 11.
Download original image
Same as previous figure for the thresholded Euler number densities. We still observe a transition towards the small scale. We note that here ξEuler(d) < − 1 showing that minima and maxima tend to be correlated at small distance (as confirmed in the next plot). Note: this measure is quite noisy as the Euler number density vanishes for low thresholded values and the threshold ρs > 0.5 is not shown.
Current usage metrics show cumulative count of Article Views (full-text article views including HTML views, PDF and ePub downloads, according to the available data) and Abstracts Views on Vision4Press platform.
Data correspond to usage on the plateform after 2015. The current usage metrics is available 48-96 hours after online publication and is updated daily on week days.
Initial download of the metrics may take a while.