Open Access
Fig. 1.
Download original image
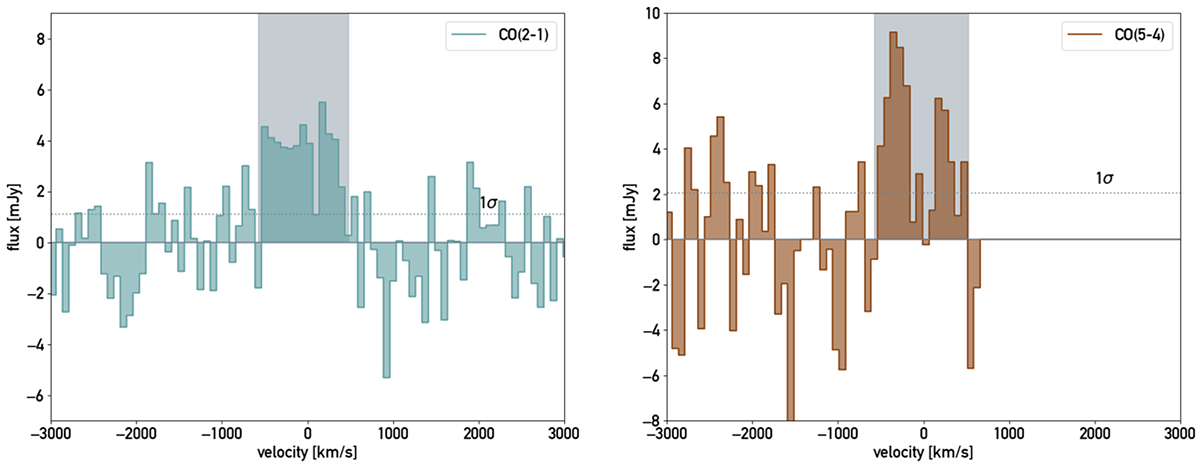
CO(2–1) (left) and CO(5–4) (right) emissions of the entire system in mJy per 75 km/s as a function of the velocity, where the centre velocity is determined from the redshift z = 1.17. The channels used to create the intensity maps are highlighted with the grey shaded area.
Current usage metrics show cumulative count of Article Views (full-text article views including HTML views, PDF and ePub downloads, according to the available data) and Abstracts Views on Vision4Press platform.
Data correspond to usage on the plateform after 2015. The current usage metrics is available 48-96 hours after online publication and is updated daily on week days.
Initial download of the metrics may take a while.