Fig. 5
Download original image
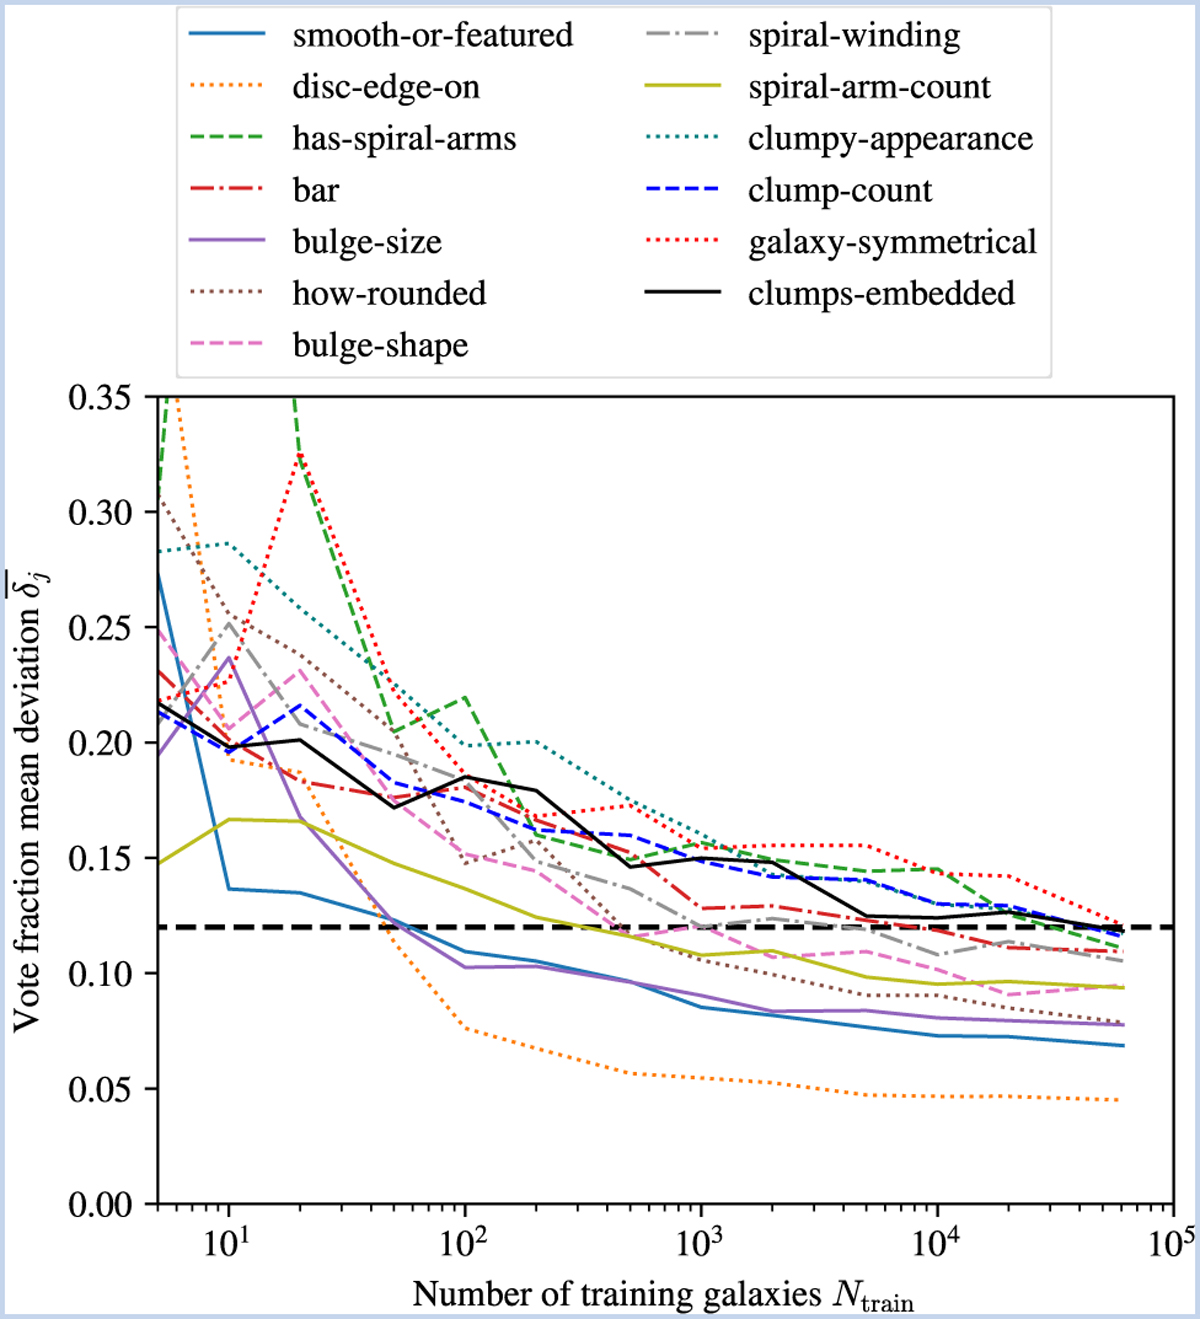
Vote fraction mean deviations of the model predictions ![]() j for the different morphology questions j of the decision tree, as a function of number of galaxies included in training Ntrain. This is illustrated for the model trained on galaxies from the complete dataset. All questions reach a mean deviation of less than 12% (dashed black line) after being trained with all available galaxies.
j for the different morphology questions j of the decision tree, as a function of number of galaxies included in training Ntrain. This is illustrated for the model trained on galaxies from the complete dataset. All questions reach a mean deviation of less than 12% (dashed black line) after being trained with all available galaxies.
Current usage metrics show cumulative count of Article Views (full-text article views including HTML views, PDF and ePub downloads, according to the available data) and Abstracts Views on Vision4Press platform.
Data correspond to usage on the plateform after 2015. The current usage metrics is available 48-96 hours after online publication and is updated daily on week days.
Initial download of the metrics may take a while.