Open Access
Fig. 1
Download original image
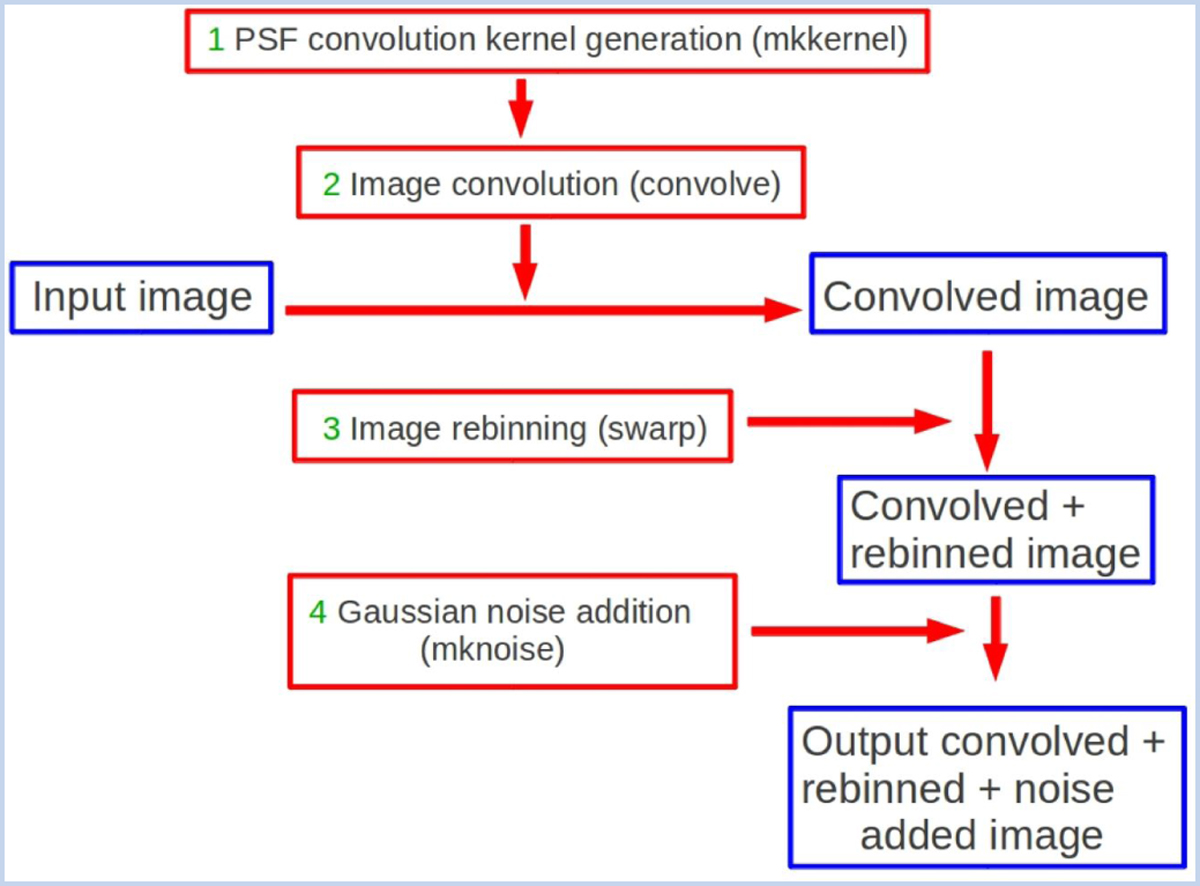
Data pipeline scheme for the emulated Euclid VIS images created as part of the Euclid Data Challenge 2. The green numbers correspond to the numbers of the description of the pipeline given in the text.
Current usage metrics show cumulative count of Article Views (full-text article views including HTML views, PDF and ePub downloads, according to the available data) and Abstracts Views on Vision4Press platform.
Data correspond to usage on the plateform after 2015. The current usage metrics is available 48-96 hours after online publication and is updated daily on week days.
Initial download of the metrics may take a while.