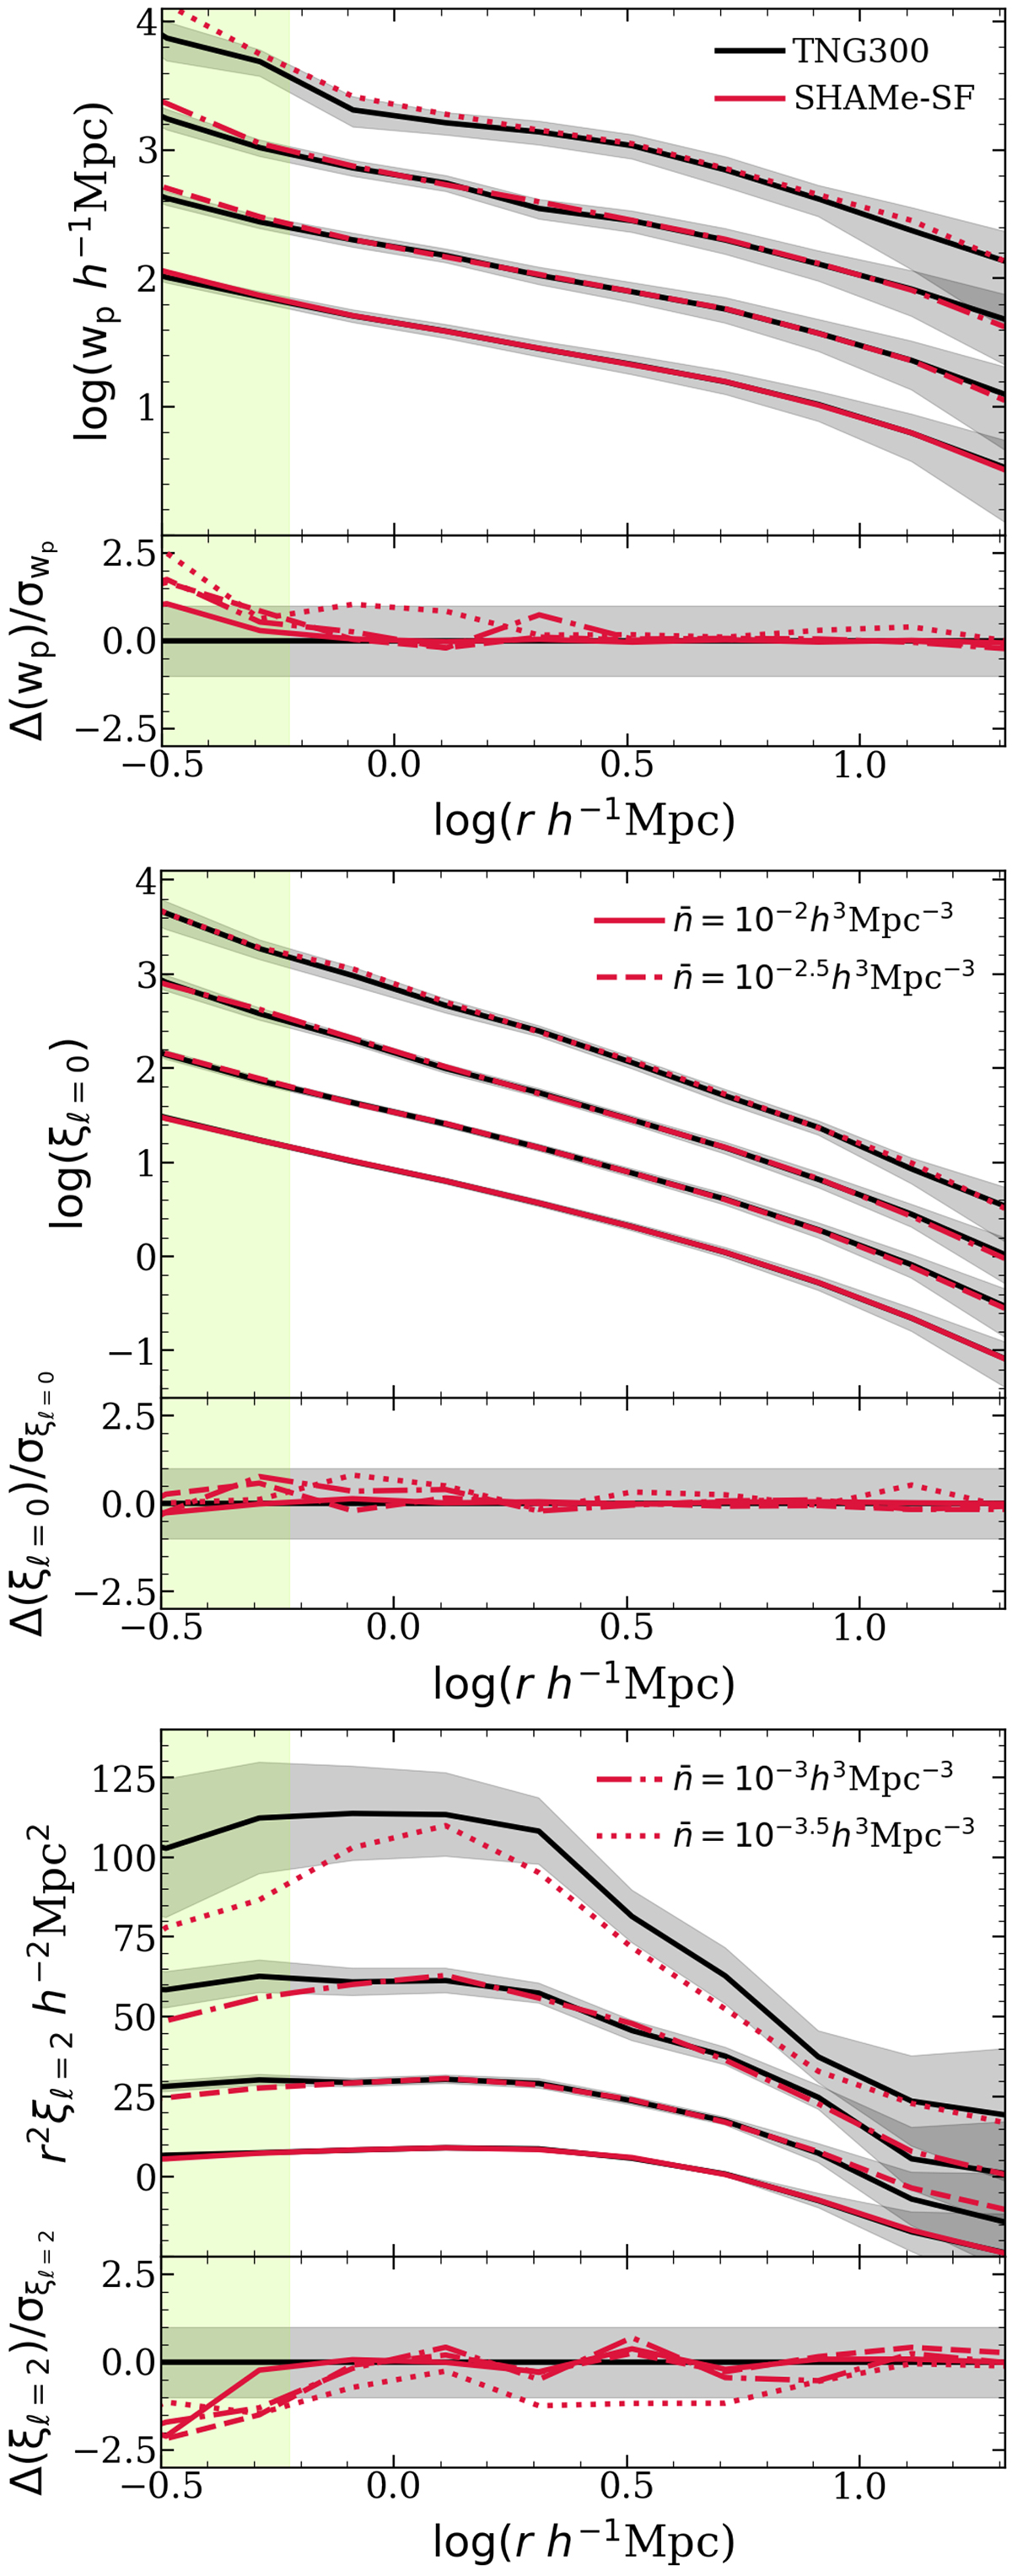
Fig. 6.
Download original image
Projected correlation function (wp), monopole, and quadrupole of the galaxies of the TNG300 simulation (black, 1σ interval in grey) and the model (red) for an SFR-selected subsample with number densities n = 10−2 (straight), 10−2.5 (dashed), 10−3 (dash-dotted), and n = 10−3.5 (dotted) h3 Mpc−3 at z = 1. The three lower number densities have been shifted on the upper panel along the y-axis for visualisation purposes. The lower panel shows the relative difference between the fits and the model normalised by the uncertainty on the measurement on TNG300, with the grey-shaded region indicating 1σ. The green-shaded region (r < 0.6 Mpc/h) indicates the region not considered in the parameter fitting.
Current usage metrics show cumulative count of Article Views (full-text article views including HTML views, PDF and ePub downloads, according to the available data) and Abstracts Views on Vision4Press platform.
Data correspond to usage on the plateform after 2015. The current usage metrics is available 48-96 hours after online publication and is updated daily on week days.
Initial download of the metrics may take a while.