Fig. 5.
Download original image
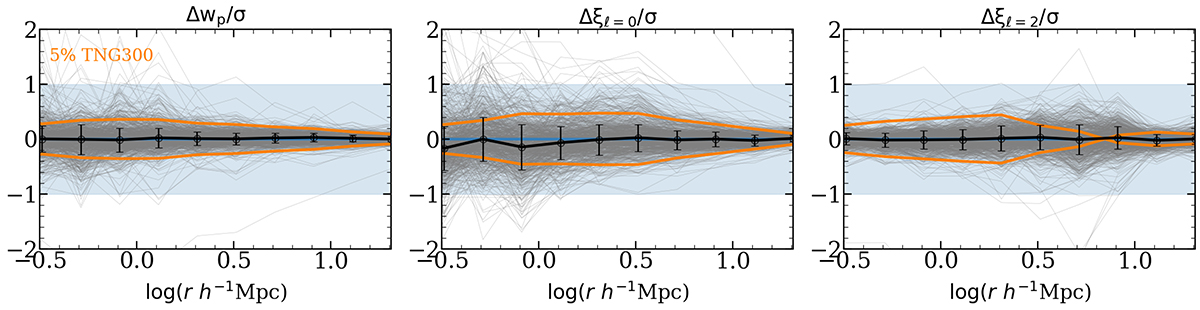
Difference between the emulator prediction and the real mock weighted by the scaled TNG300 error for the highest number density (![]() ) at z = 1. Error bars mark the 68% intervals of the distribution of the emulator predictions. We plot 800 randomly selected lines in grey. We include in orange the contribution to the total uncertainty (σ) of the 5% of the TNG300 signal. The total uncertainty (including the JN samples) is marked with a blue-shaded region to aid visual presentation.
) at z = 1. Error bars mark the 68% intervals of the distribution of the emulator predictions. We plot 800 randomly selected lines in grey. We include in orange the contribution to the total uncertainty (σ) of the 5% of the TNG300 signal. The total uncertainty (including the JN samples) is marked with a blue-shaded region to aid visual presentation.
Current usage metrics show cumulative count of Article Views (full-text article views including HTML views, PDF and ePub downloads, according to the available data) and Abstracts Views on Vision4Press platform.
Data correspond to usage on the plateform after 2015. The current usage metrics is available 48-96 hours after online publication and is updated daily on week days.
Initial download of the metrics may take a while.