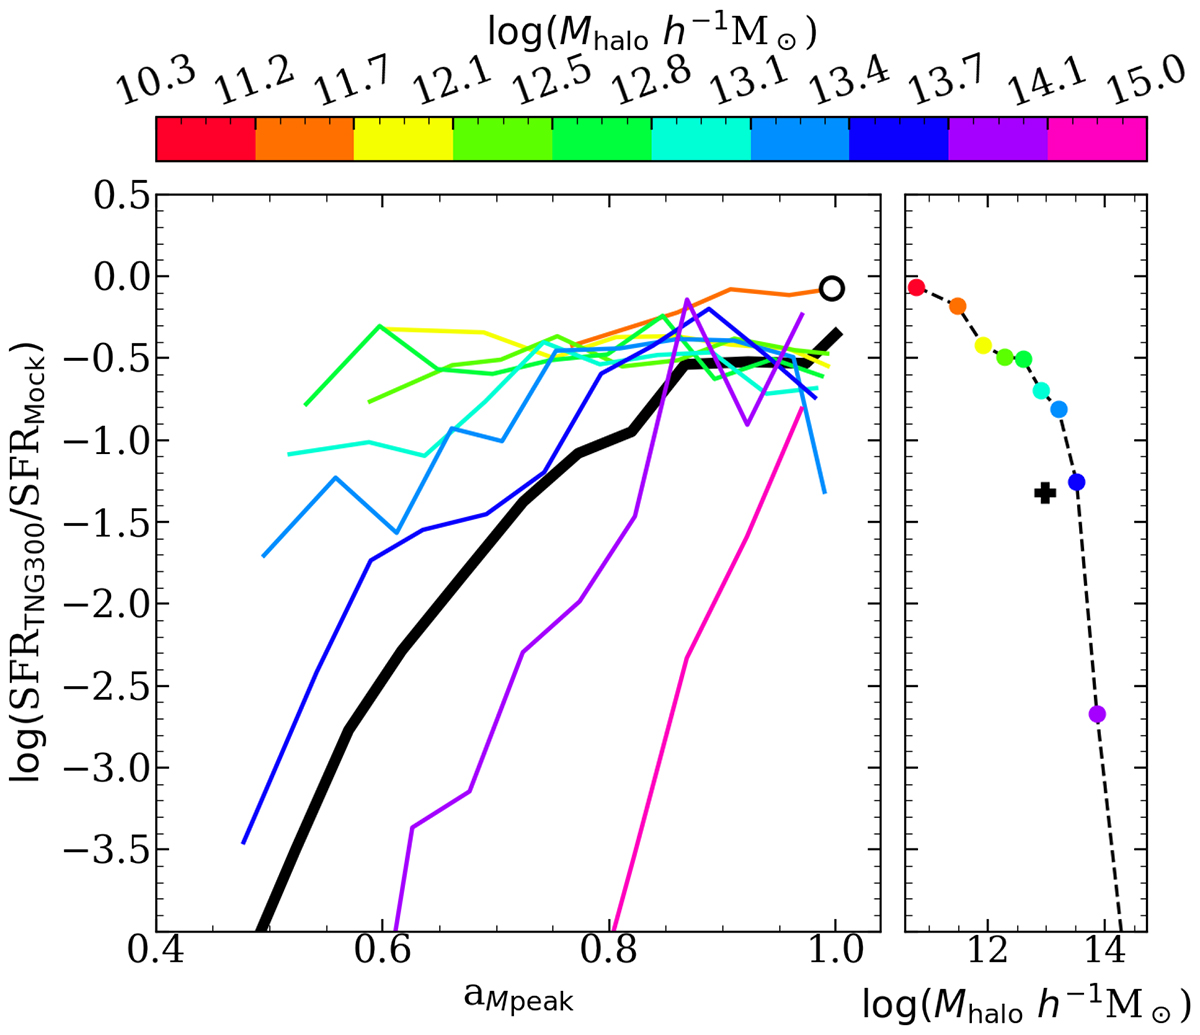
Fig. 4.
Download original image
For satellites, mean difference (in log scale) between the TNG300 values and the predicted ones using only Eq. (2) and the semi-sorted scatter for a subsample of galaxies on a fixed [Vpeak, Vpeak/Vvir] interval for different Mhalo values (colour coding) (right). Left: The same, but plotted as a function of aMpeak (in scale factor units) maintaining the Mhalo intervals. The black thick line shows the behaviour when the whole sample is considered. The circle represents the mean value for central galaxies with aMpeak ∼ 1.
Current usage metrics show cumulative count of Article Views (full-text article views including HTML views, PDF and ePub downloads, according to the available data) and Abstracts Views on Vision4Press platform.
Data correspond to usage on the plateform after 2015. The current usage metrics is available 48-96 hours after online publication and is updated daily on week days.
Initial download of the metrics may take a while.