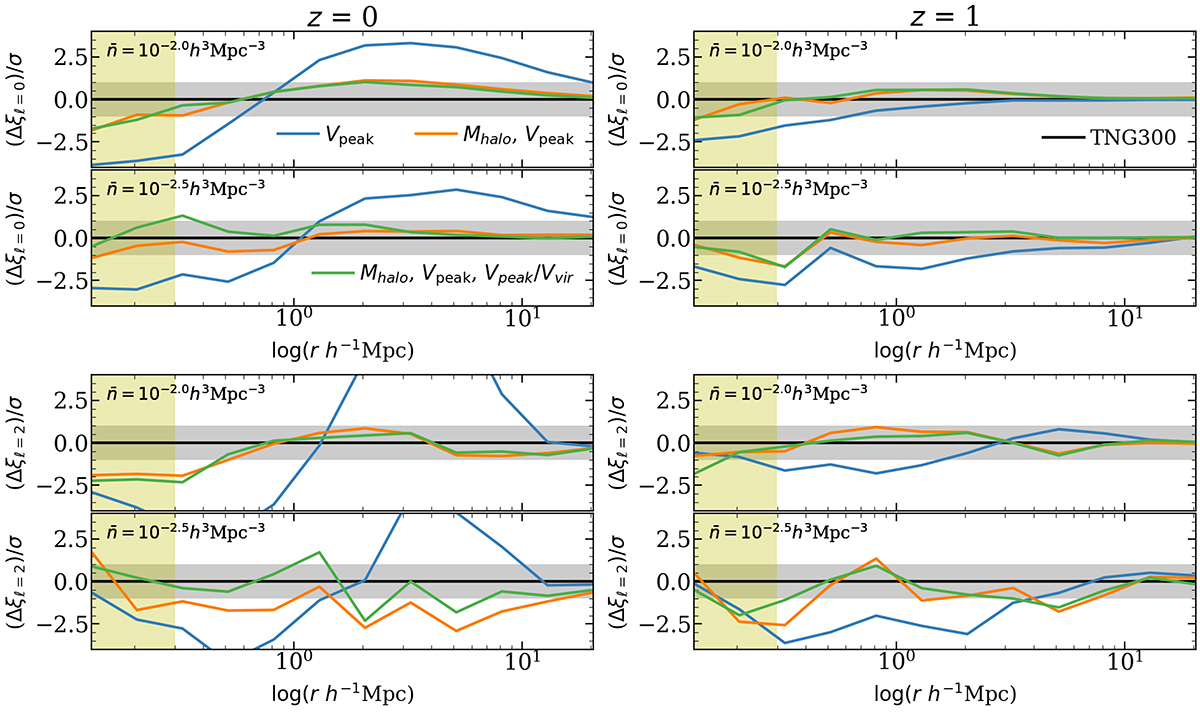
Fig. 2.
Download original image
Difference between the predicted and TNG monopole (top block) and quadrupole (bottom block) of the redshift space cross-correlation function between the test half of the box and the whole box. We show three models with different numbers of subhalo properties. We tested two redshifts, z = 0 (left) and z = 1 (right), and two number densities for each statistic (n = 10−2 h3 Mpc−3, upper panel of each block, and n = 10−2.5 h3 Mpc−3 lower panel). The grey-shaded intervals mark the 1σ regions. The yellow-shaded region (r < 0.316 h−1 Mpc) is not used to compute the χ2 (see Appendix B).
Current usage metrics show cumulative count of Article Views (full-text article views including HTML views, PDF and ePub downloads, according to the available data) and Abstracts Views on Vision4Press platform.
Data correspond to usage on the plateform after 2015. The current usage metrics is available 48-96 hours after online publication and is updated daily on week days.
Initial download of the metrics may take a while.