Fig. 1.
Download original image
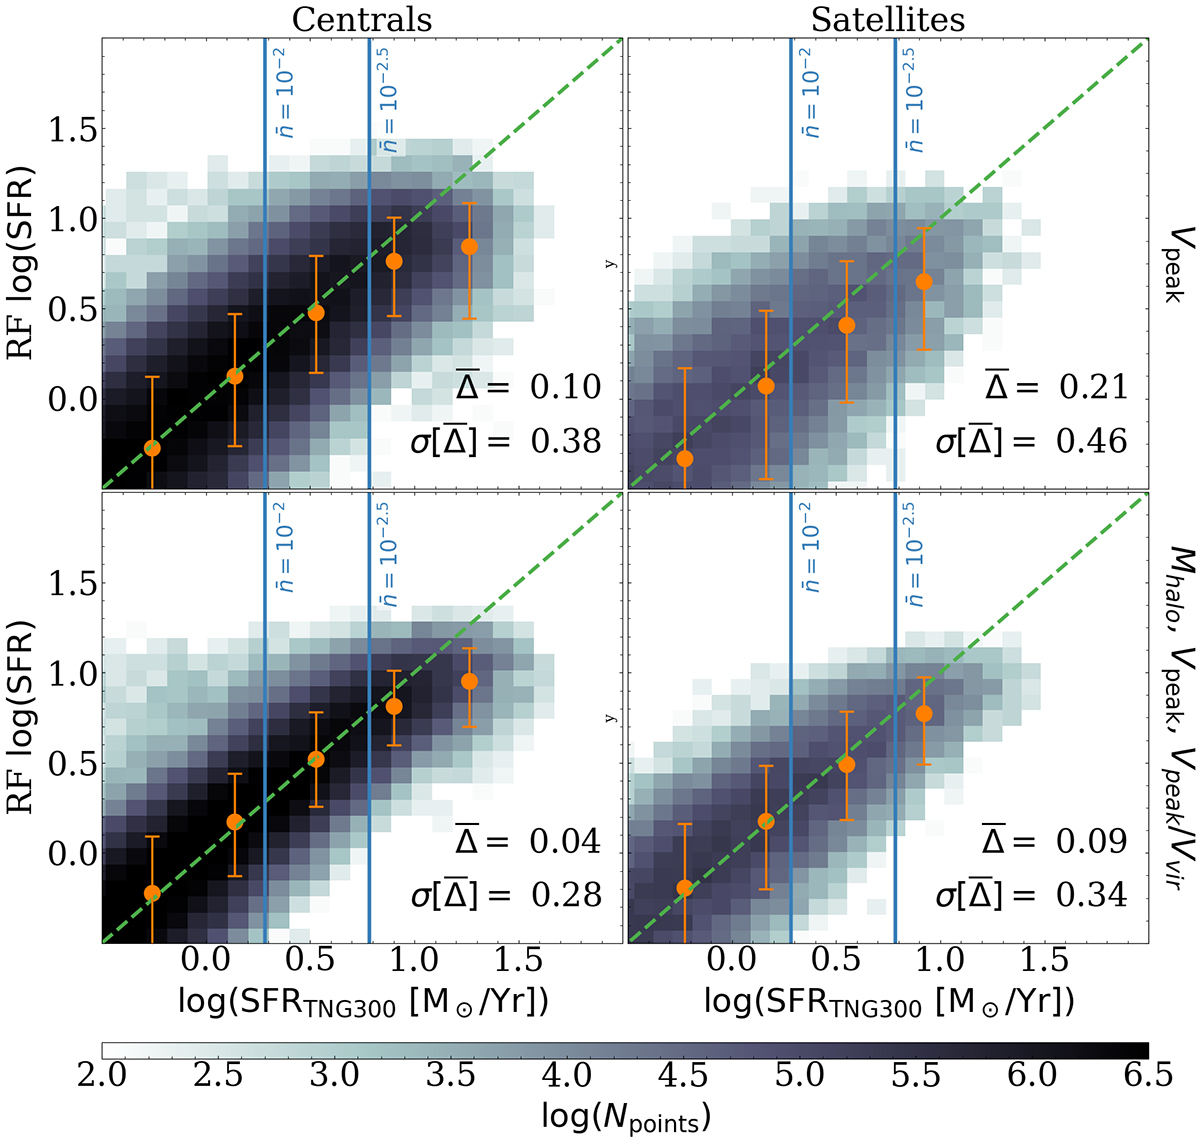
Comparison between the real SFR values (TNG300, x-axis) and the ones predicted by the RF (y-axis) for the validation sample at z = 1 using one of the best three models with three subhalo properties (bottom) and the model with only Vpeak (top). Blue lines show the SFR values that define SFR-selected number densities of ![]() and 10−2.5 h3 Mpc−3 for the TNG300 values. Circles with error bars indicate the median, 16th, and 84th percentiles, which are only calculated when the number of points in a 0.4 dex bin is larger than 1000. The dashed green line indicates x = y. The term
and 10−2.5 h3 Mpc−3 for the TNG300 values. Circles with error bars indicate the median, 16th, and 84th percentiles, which are only calculated when the number of points in a 0.4 dex bin is larger than 1000. The dashed green line indicates x = y. The term ![]() is the mean deviation between the real and predicted values, and it is calculated in log scale using all the subhalos with log(SFR) > 0 and assuming SFR = 10−4 M⊙/yr for quenched galaxies.
is the mean deviation between the real and predicted values, and it is calculated in log scale using all the subhalos with log(SFR) > 0 and assuming SFR = 10−4 M⊙/yr for quenched galaxies.
Current usage metrics show cumulative count of Article Views (full-text article views including HTML views, PDF and ePub downloads, according to the available data) and Abstracts Views on Vision4Press platform.
Data correspond to usage on the plateform after 2015. The current usage metrics is available 48-96 hours after online publication and is updated daily on week days.
Initial download of the metrics may take a while.