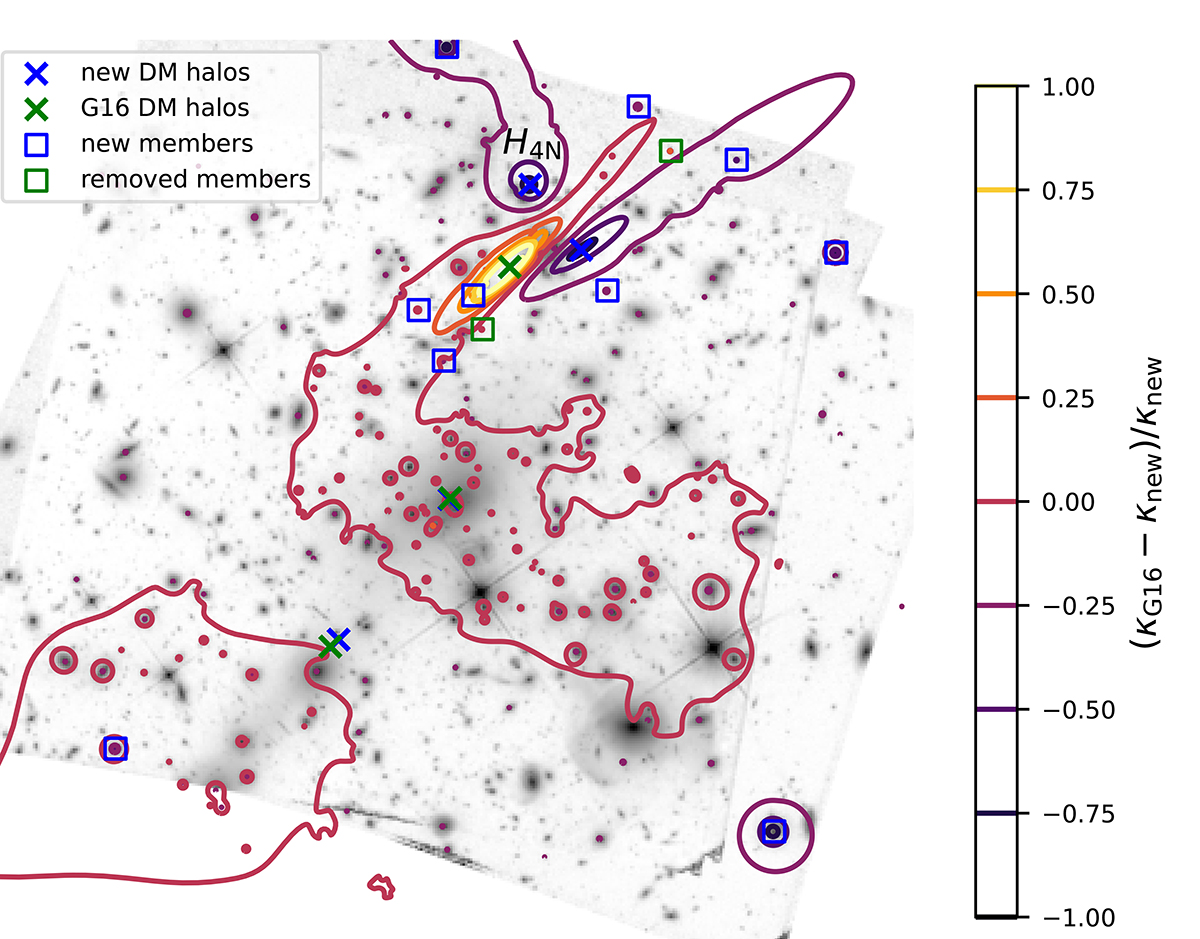
Fig. 7.
Download original image
Relative difference between the convergence map from G16 and our final total mass model, indicated by color-coded contour levels. We highlight the positions of new (blue) and G16/removed mass density profiles (green), for the DM halos (crosses) and cluster members (squares). The spherical halo H4N is also labeled. For an improved orientation, we show in the background the red channel of the HFF color image (see Fig. 1).
Current usage metrics show cumulative count of Article Views (full-text article views including HTML views, PDF and ePub downloads, according to the available data) and Abstracts Views on Vision4Press platform.
Data correspond to usage on the plateform after 2015. The current usage metrics is available 48-96 hours after online publication and is updated daily on week days.
Initial download of the metrics may take a while.