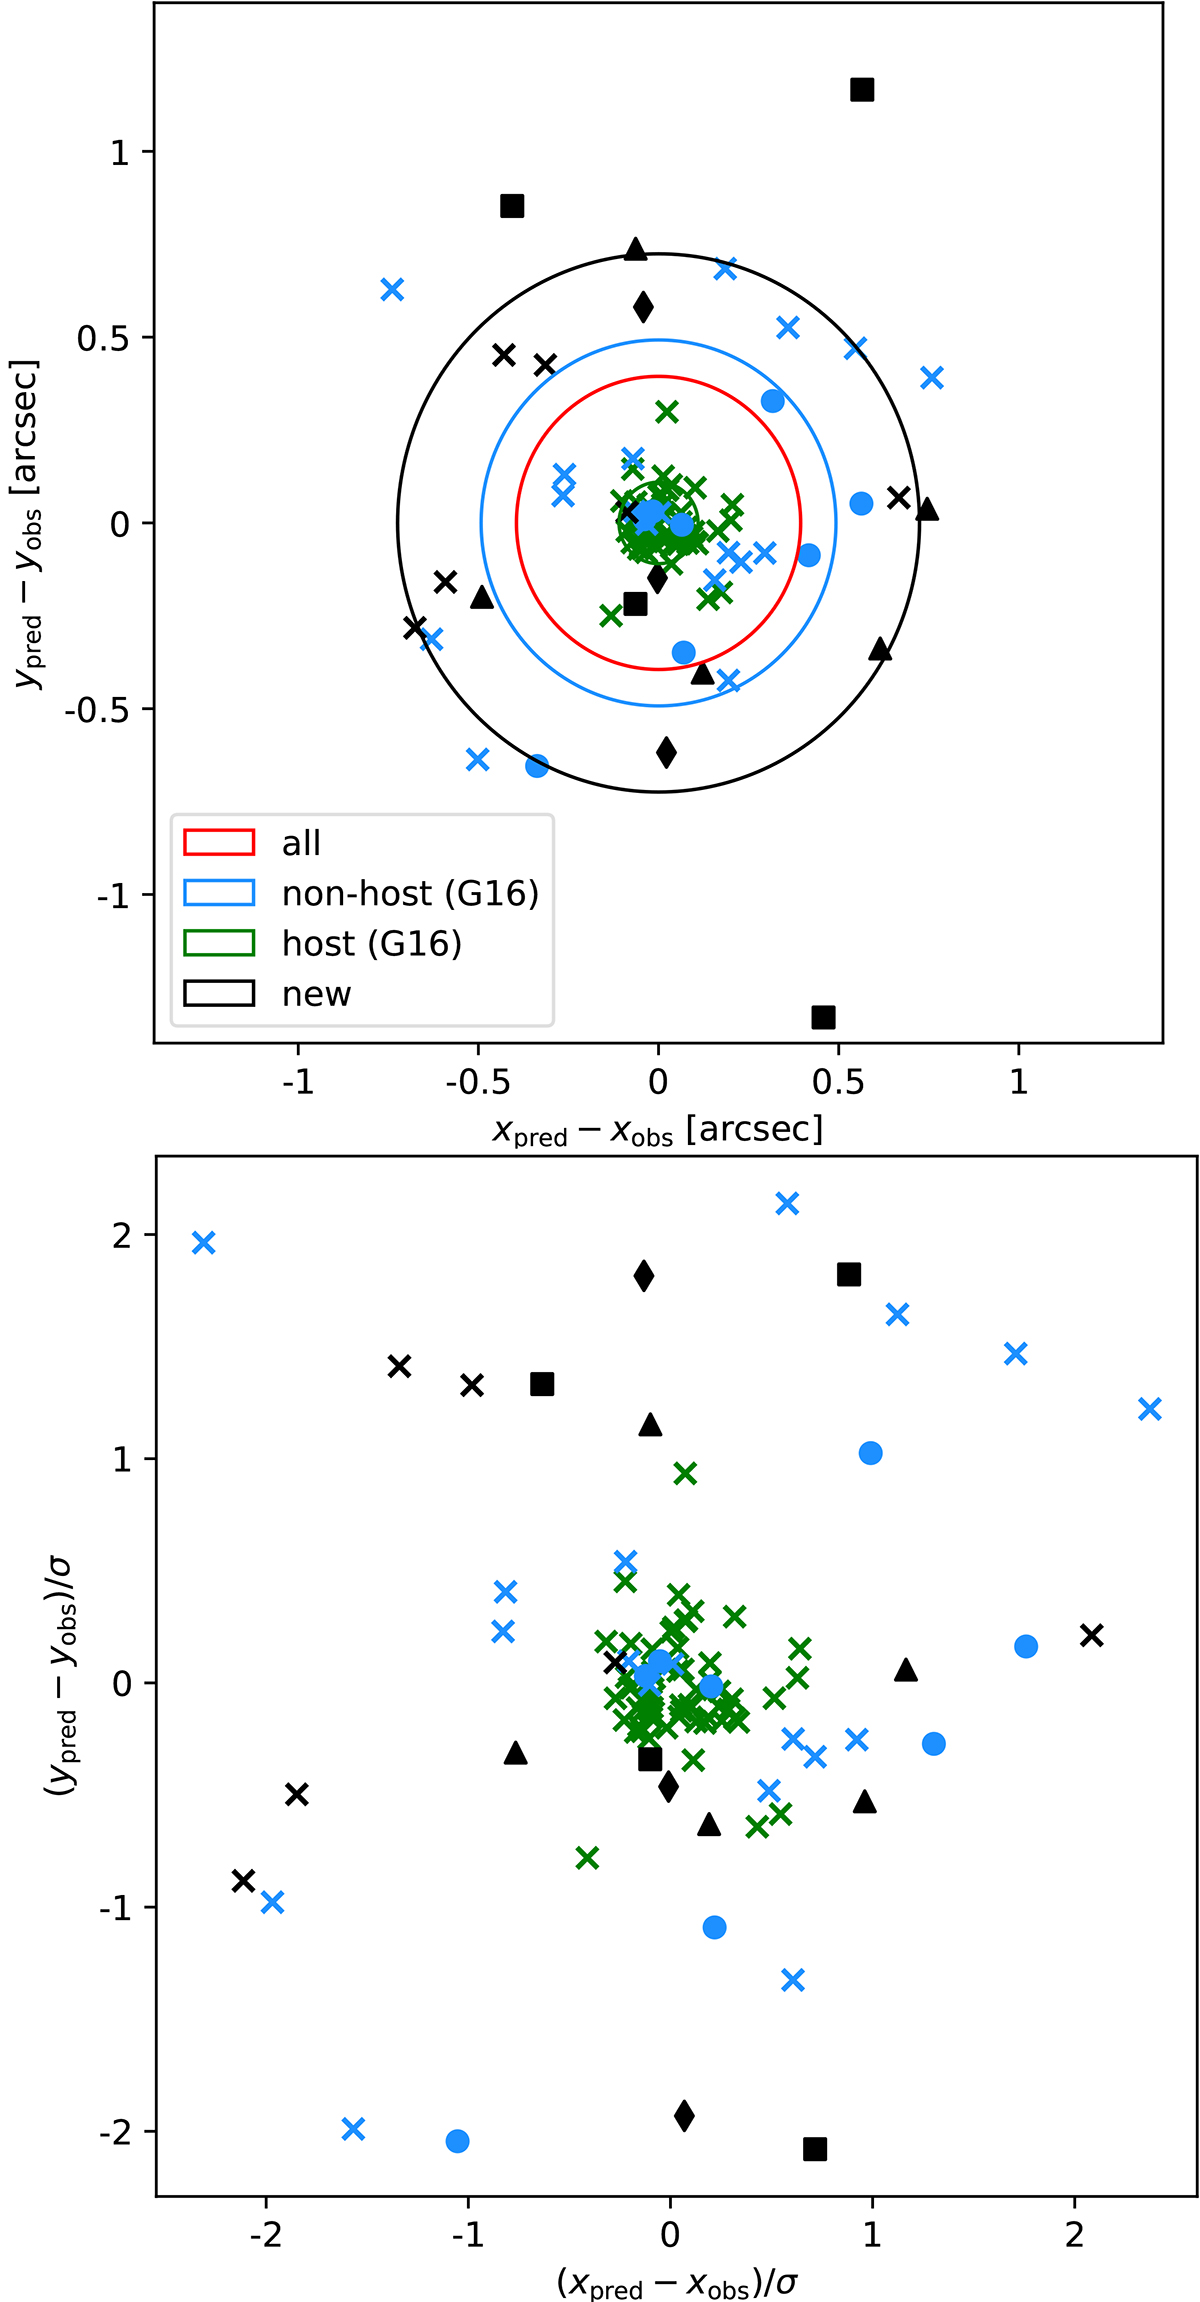
Fig. 6.
Download original image
Separation between predicted and observed image positions of the multiple images (top) and positional differences scaled by the corresponding uncertainty (bottom) for our final reference model. The multiple images are grouped into images (1) belonging to the SN host (green), and at different redshifts, both from (2) G16 (blue) and (3) this work (black) listed in Table 2. We highlight the multiple images with variable redshift (dots), those which are only identified by MUSE (squares for family 401 and triangles otherwise), and family 301 (diamonds). In the top panel, we further indicate the corresponding RMS values and the total RMS of 0.39″ (red) via the radii of the circles.
Current usage metrics show cumulative count of Article Views (full-text article views including HTML views, PDF and ePub downloads, according to the available data) and Abstracts Views on Vision4Press platform.
Data correspond to usage on the plateform after 2015. The current usage metrics is available 48-96 hours after online publication and is updated daily on week days.
Initial download of the metrics may take a while.