Open Access
Fig. 5.
Download original image
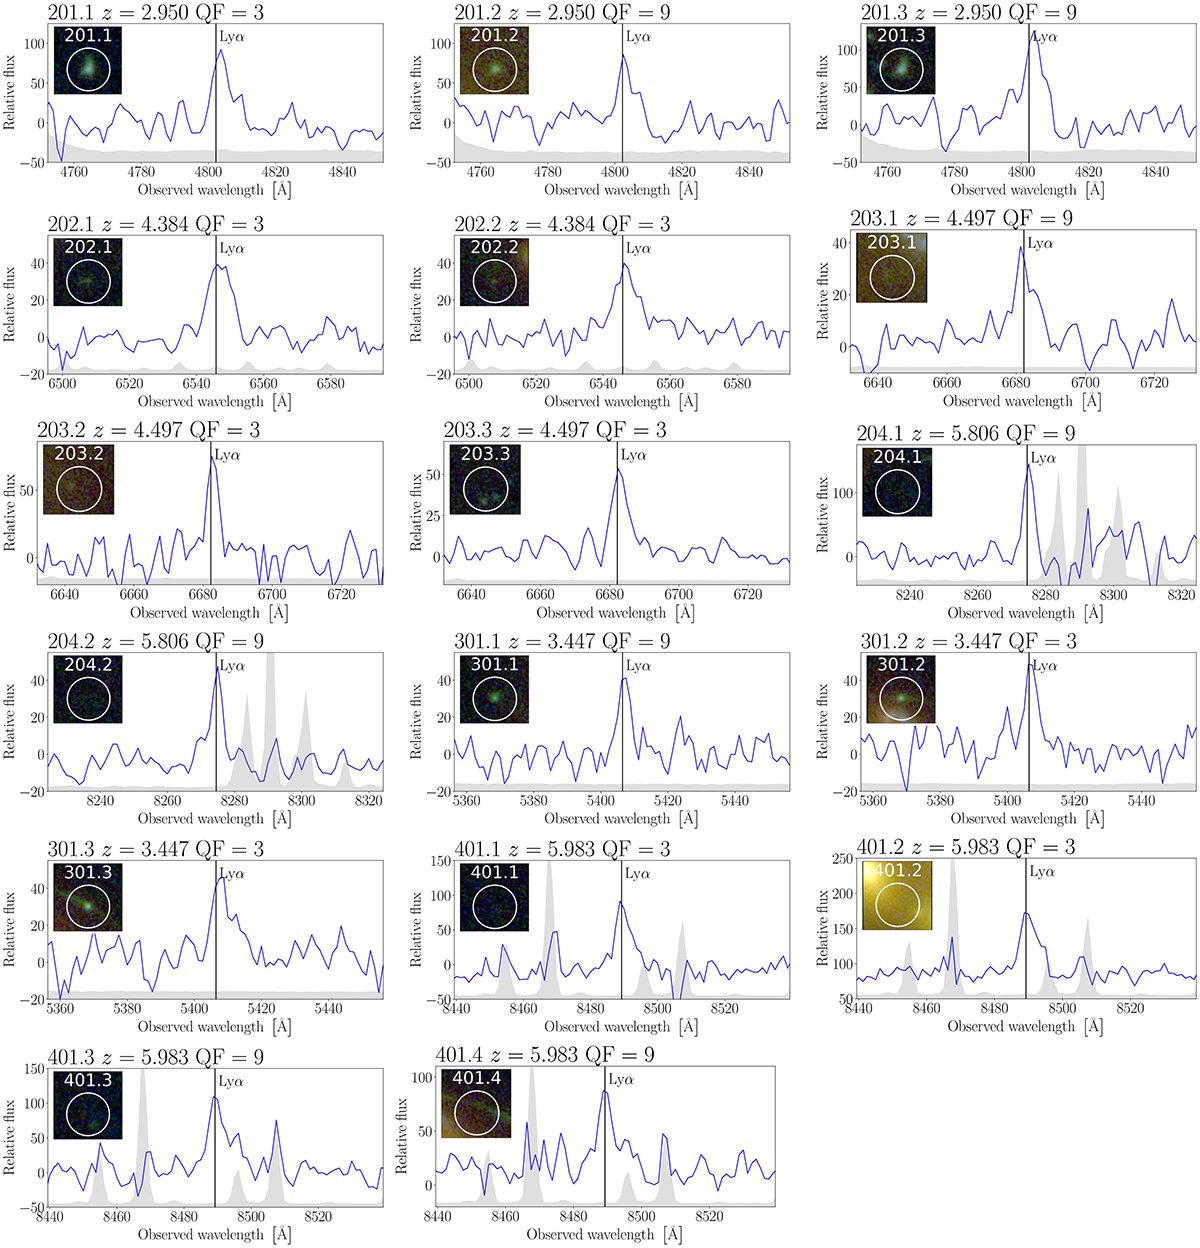
Spectra of the newly discovered multiple images. The vertical line indicates the observed position of the Lyman-α emission and the rescaled variance is shown in gray. ID, redshift and quality flag are indicated in each figure title. The HST cutouts are 2″ on each side, and north is up and east is left.
Current usage metrics show cumulative count of Article Views (full-text article views including HTML views, PDF and ePub downloads, according to the available data) and Abstracts Views on Vision4Press platform.
Data correspond to usage on the plateform after 2015. The current usage metrics is available 48-96 hours after online publication and is updated daily on week days.
Initial download of the metrics may take a while.