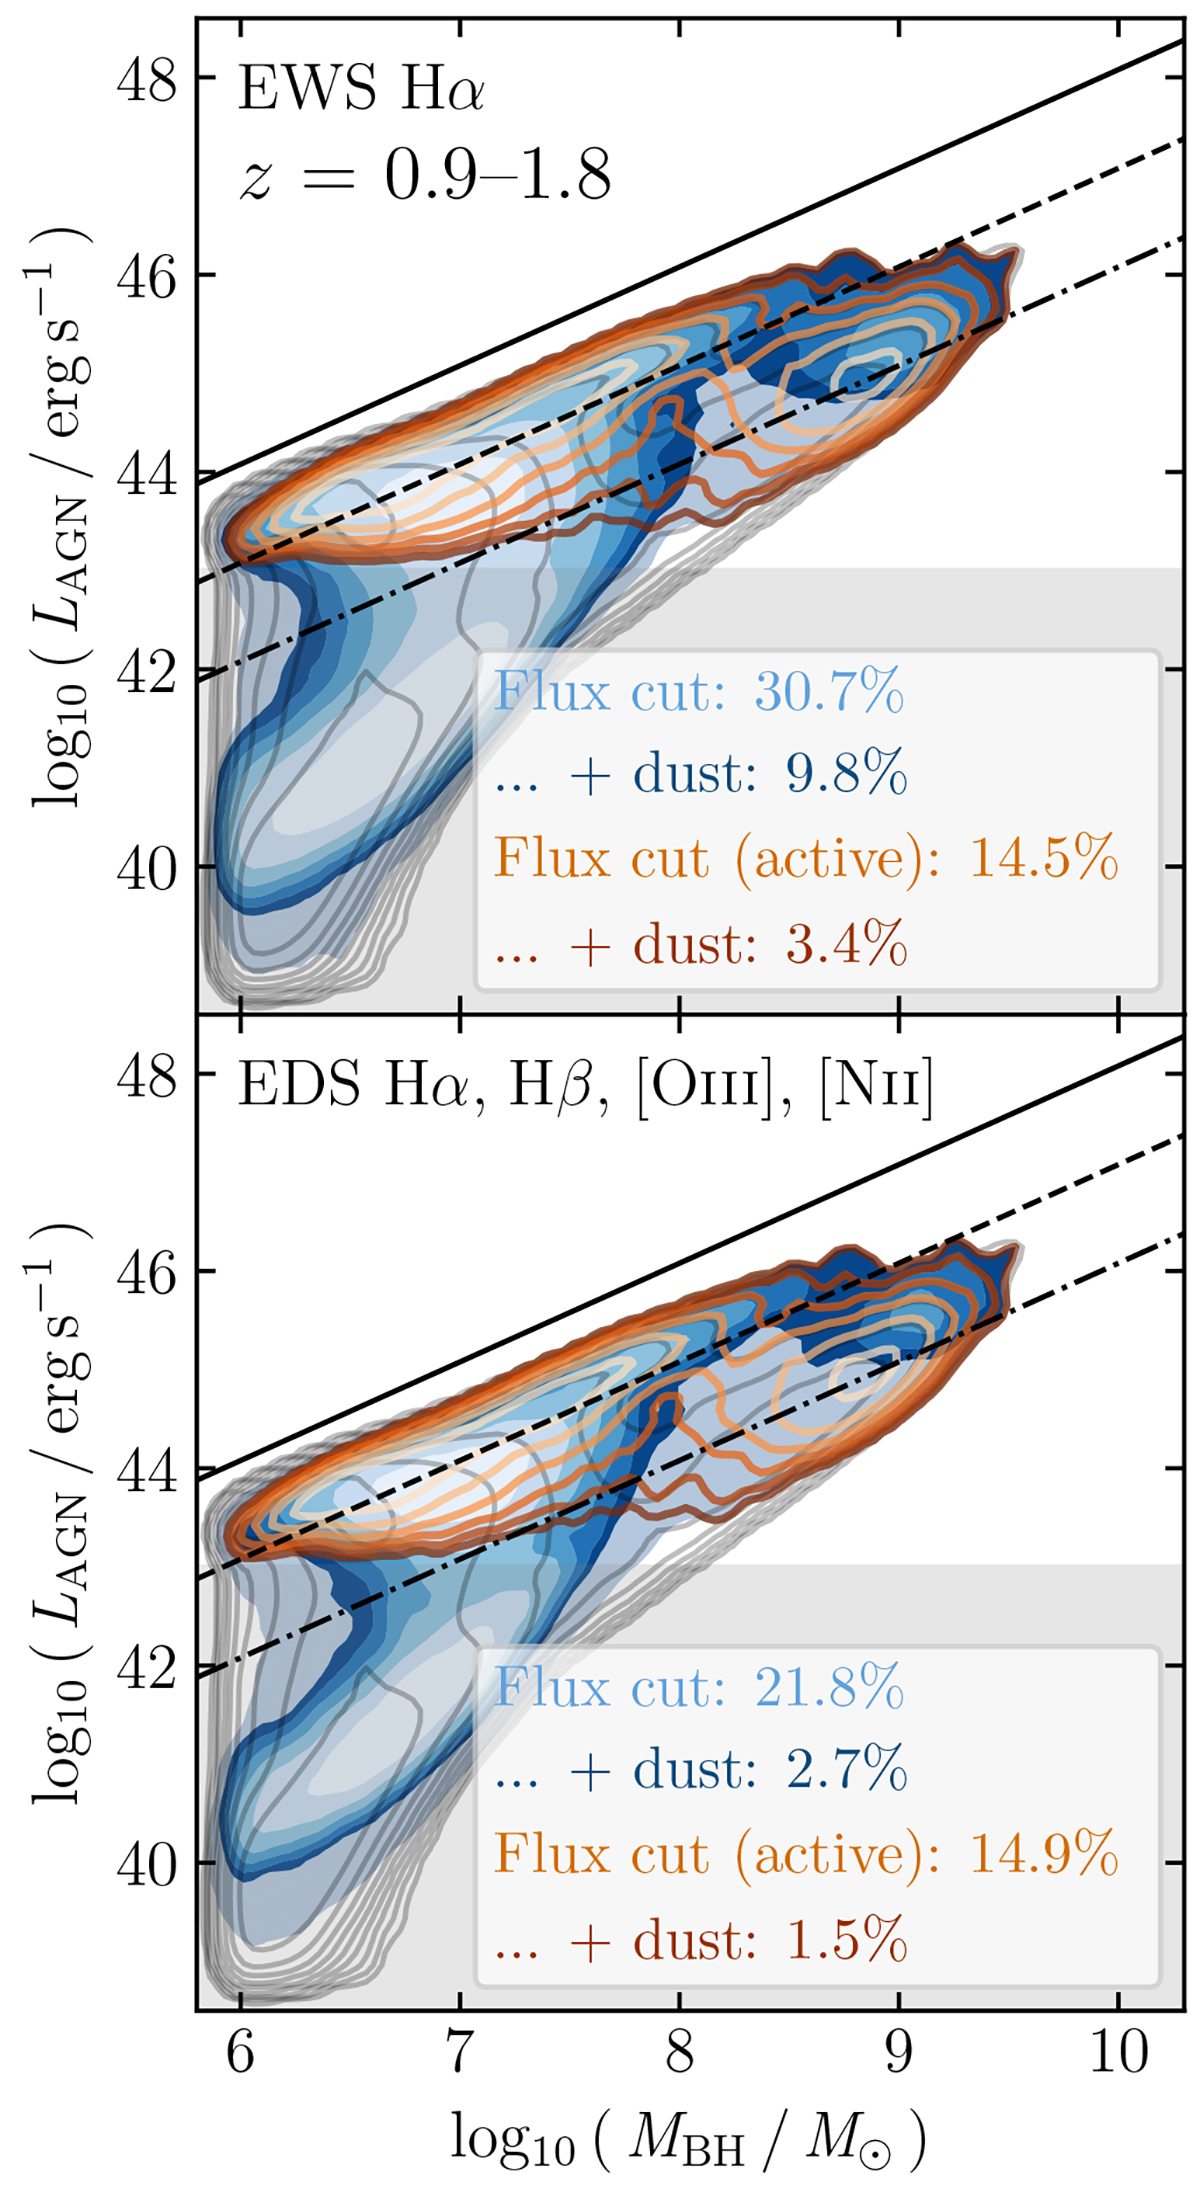
Fig. 9.
Download original image
Scaling relation between the LAGN and black hole mass MBH for GAEA-LC populations in the redshift range 0.9–1.8, following the same layout as Fig. 8. Additionally shown is the active sub-sample of the dust-attenuated population (orange contours) and its observability compared to the entire active population (orange percentages). For comparison, black lines show fractions of the Eddington limit: 1 Ledd (solid), 0.1 Ledd (dashed), and 0.01 Ledd (dash-dotted).
Current usage metrics show cumulative count of Article Views (full-text article views including HTML views, PDF and ePub downloads, according to the available data) and Abstracts Views on Vision4Press platform.
Data correspond to usage on the plateform after 2015. The current usage metrics is available 48-96 hours after online publication and is updated daily on week days.
Initial download of the metrics may take a while.