Fig. 8.
Download original image
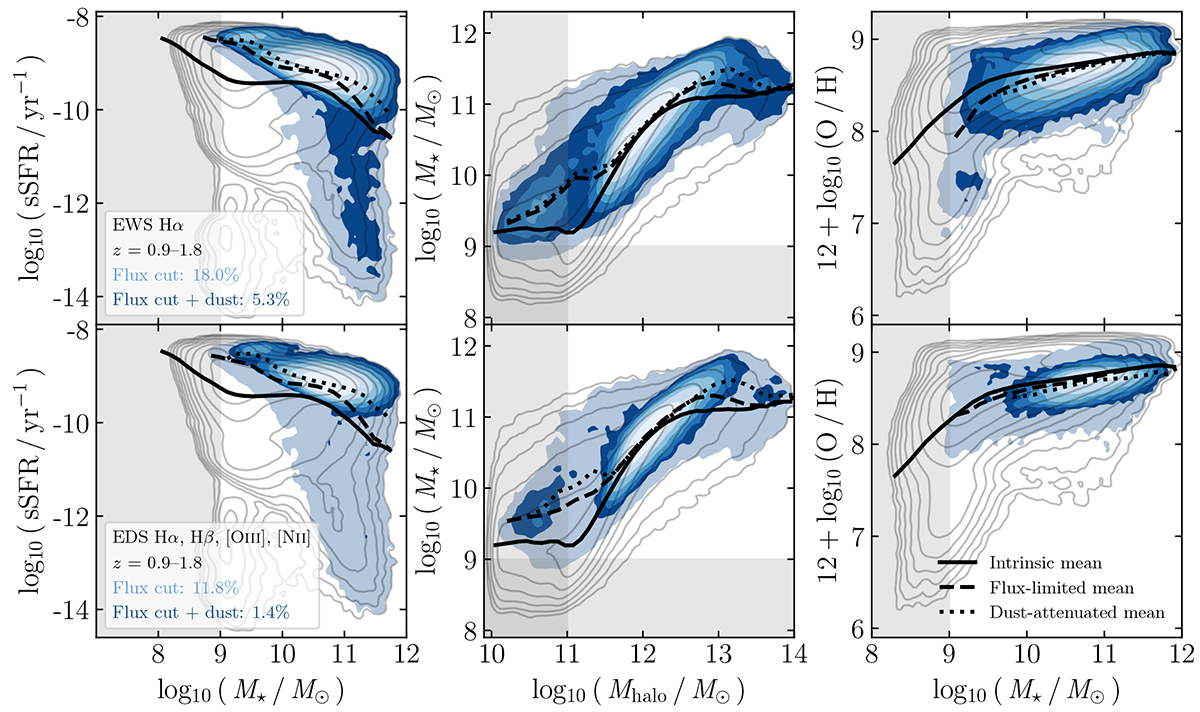
Scaling relations between sSFR and M⋆ (left column), M⋆ and Mhalo (middle column), and O/H abundance versus M⋆ (right column) for intrinsic (grey contour lines), flux-limited (light blue area), and dust-attenuated (blue contours) GAEA-LC populations in the redshift range 0.9–1.8. Shown are galaxies emitting Hα fluxes above the EWS cut (top row) and Hα, Hβ, [O III], and [N II] fluxes above the EDS cut (bottom row). The redshift range reflects the entire detectable range for the chosen lines in the given survey configuration. Percentages in the left panels indicate the observable percentage of the flux-limited sample (light blue) and dust-attenuated sample (dark blue). Each panel also contains the mean of the intrinsic (solid lines), flux-limited (dashed), and dust-attenuated (dotted) GAEA-LC populations. Grey panels indicate GAEA’s resolution limits in stellar mass (M⋆ < 109 M⊙) and halo mass (Mhalo < 1011 M⊙).
Current usage metrics show cumulative count of Article Views (full-text article views including HTML views, PDF and ePub downloads, according to the available data) and Abstracts Views on Vision4Press platform.
Data correspond to usage on the plateform after 2015. The current usage metrics is available 48-96 hours after online publication and is updated daily on week days.
Initial download of the metrics may take a while.