Fig. 7.
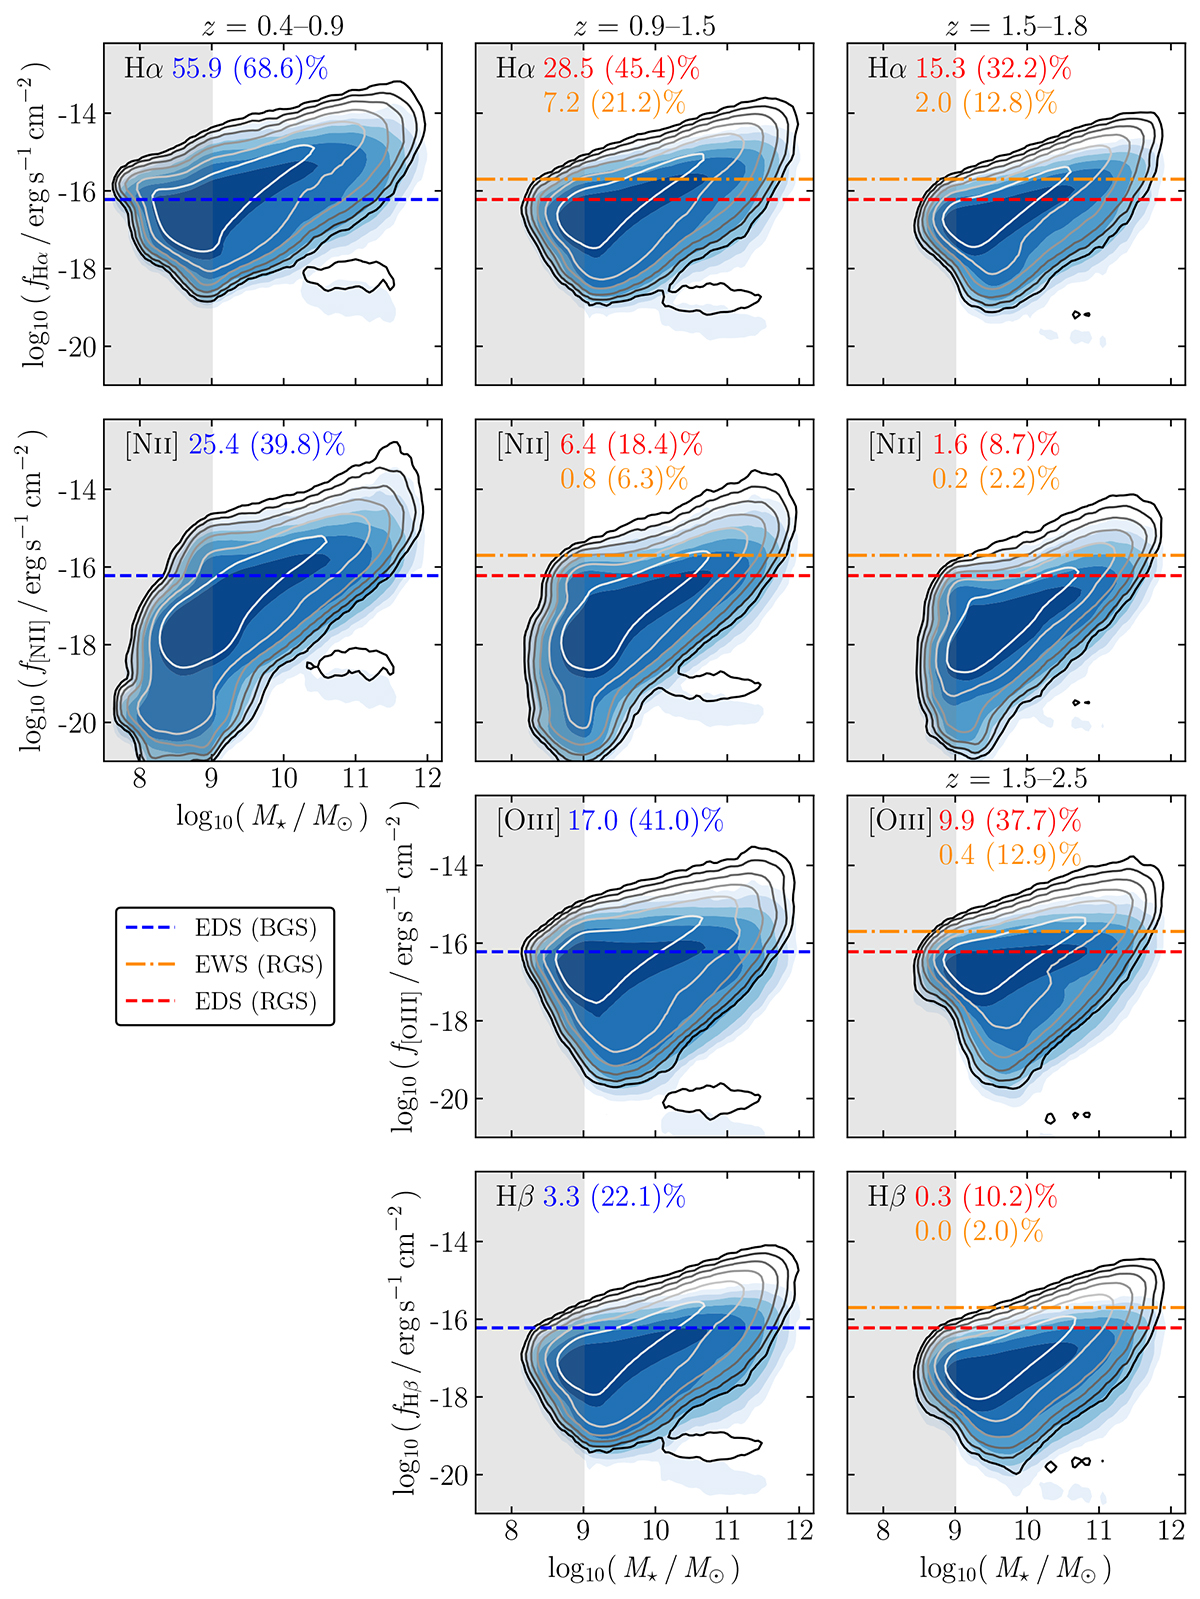
Download original image
Location of intrinsic (grey contour lines) and dust-attenuated, but not flux-limited (blue contours) GAEA-LC galaxy populations in the Hα (top row), [N II] (second row), Hβ (third row), and [O III] (bottom row) line flux-stellar mass plane at different redshift ranges, following their observability with Euclid’s grisms given the line’s wavelength (different columns as indicated by the legend). Overplotted are the flux limits of the blue and red grisms in the Deep Survey mode (EDS, blue and red dashed lines), and the red grism in the Wide Survey mode (EWS, yellow dash-dotted lines). Grey panels mark GAEA’s resolution limit of stellar masses below 109 M⊙. Percentages indicate the observable fractions of the resolved sample above 109 M⊙ when applying the EWS or EDS limit to the dust-attenuated emission-line fluxes (unattenuated fluxes in parentheses, colours reflecting survey mode and grism).
Current usage metrics show cumulative count of Article Views (full-text article views including HTML views, PDF and ePub downloads, according to the available data) and Abstracts Views on Vision4Press platform.
Data correspond to usage on the plateform after 2015. The current usage metrics is available 48-96 hours after online publication and is updated daily on week days.
Initial download of the metrics may take a while.