Fig. 6.
Download original image
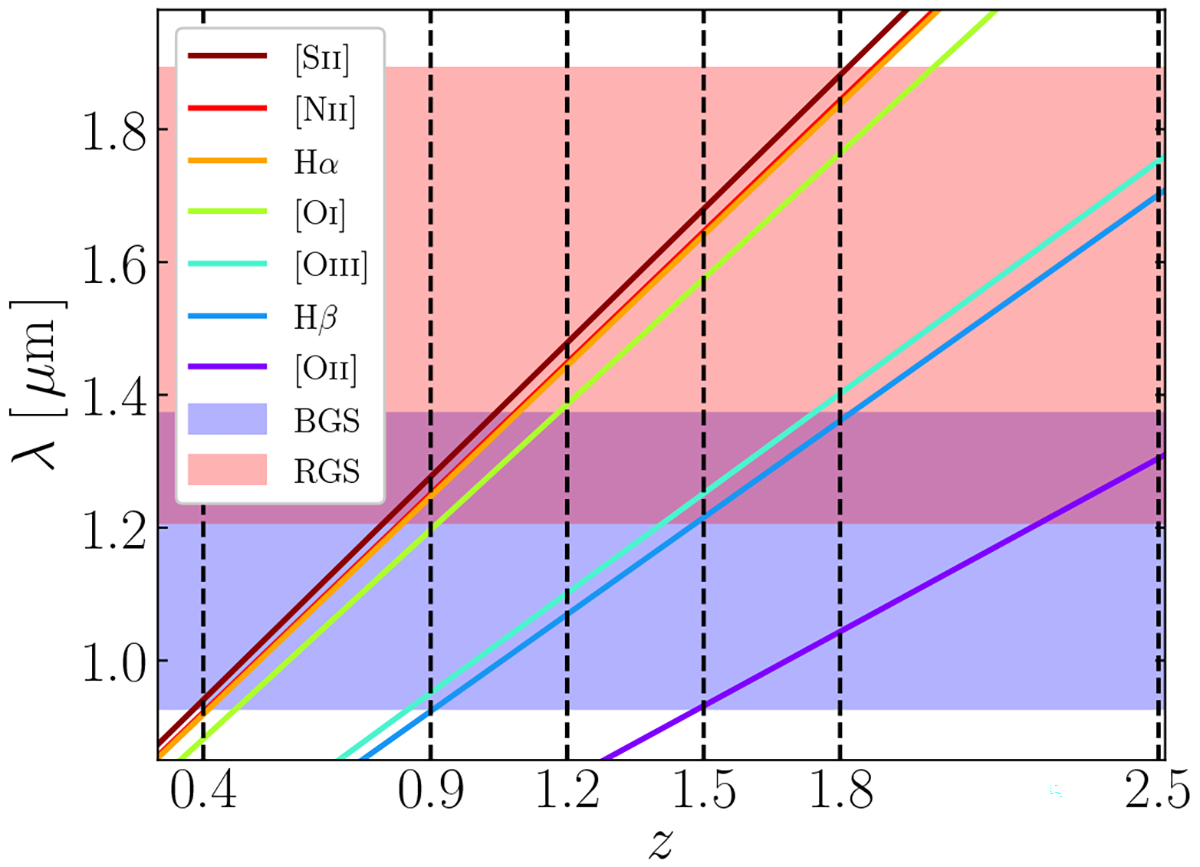
Redshifted wavelengths of strong emission lines in the rest-frame optical (crimson: [S II]λ6724, red: [N II]λ6584, yellow: Hα, green: [O I]λ6300, cyan: [O III]λ5007, blue: Hβ, and purple: [O II]λ3727) and their resulting detectability using Euclid’s blue grism (BGS, blue shaded area) and red grism (RGS, red shaded area). The redshift bins used for the following analysis (vertical dashed lines) were chosen according to the overlap of observed wavelengths with the BGS and RGS sensitivity ranges, 0.93–1.37 μm and 1.21–1.89 μm, respectively.
Current usage metrics show cumulative count of Article Views (full-text article views including HTML views, PDF and ePub downloads, according to the available data) and Abstracts Views on Vision4Press platform.
Data correspond to usage on the plateform after 2015. The current usage metrics is available 48-96 hours after online publication and is updated daily on week days.
Initial download of the metrics may take a while.