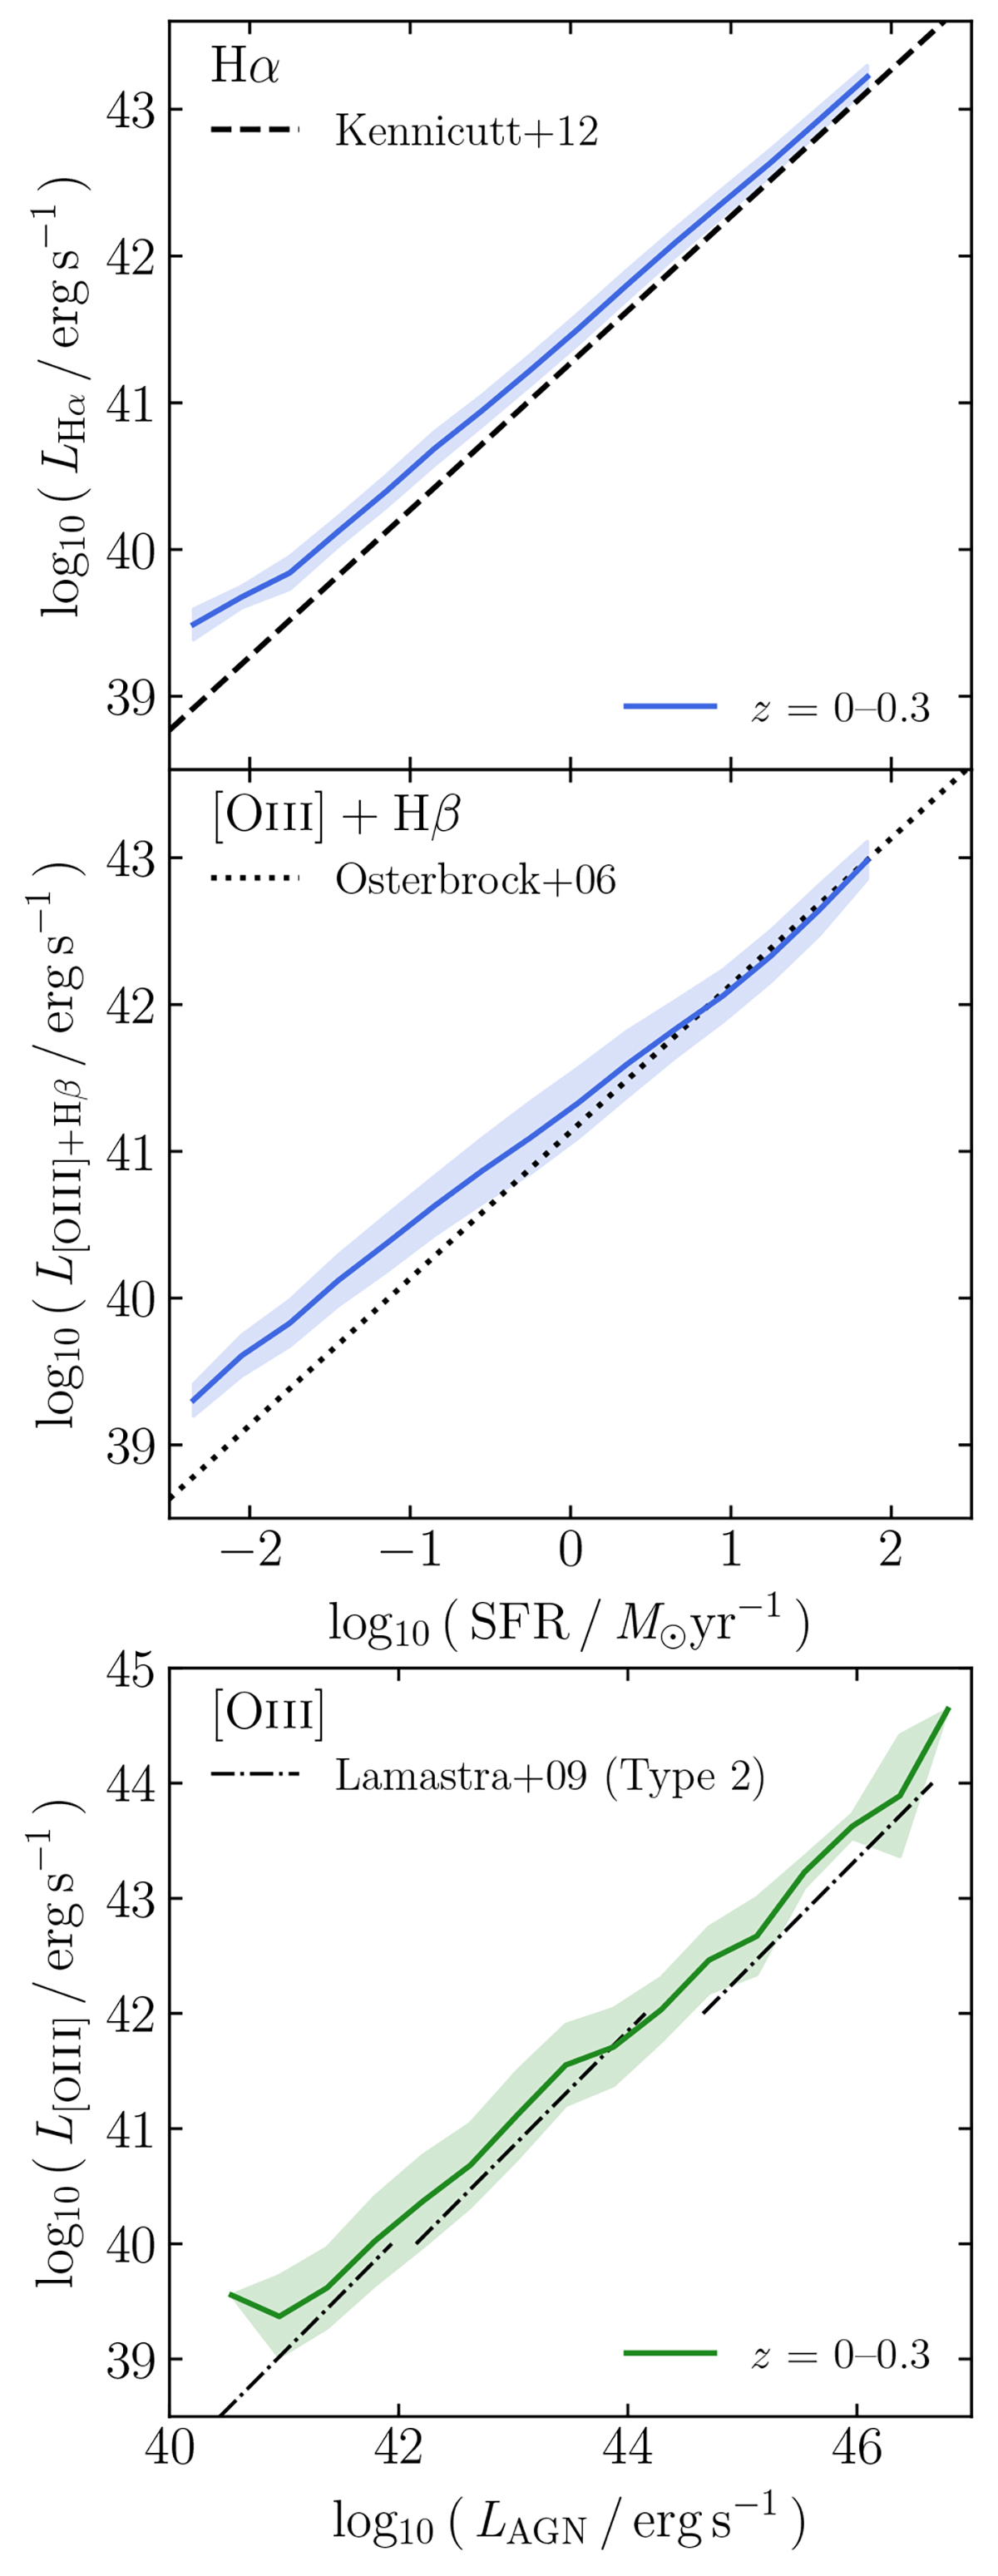
Fig. 5.
Download original image
Average Hα (first panel, blue line) and [O III] + Hβ (second panel, blue line) line luminosities versus the SFR for GAEA-LC galaxies with specific SFR > 10−10.5 yr−1 in the redshift range 0–0.3, alongside the one standard deviation scatter (shaded area). Overplotted, for comparison, are widely used relations from Kennicutt & Evans (2012, for Hα, dashed line) and Osterbrock & Ferland (2006, for [O III] + Hβ, dotted line). The bottom panel shows the average [O III] line luminosity versus AGN luminosity for active GAEA-LC galaxies with a 1σ scatter (green line and shaded area), plotted alongside the relation found by Lamastra et al. (2009, dash-dotted line) from a sample of 61 type-2 AGNs with z < 0.83.
Current usage metrics show cumulative count of Article Views (full-text article views including HTML views, PDF and ePub downloads, according to the available data) and Abstracts Views on Vision4Press platform.
Data correspond to usage on the plateform after 2015. The current usage metrics is available 48-96 hours after online publication and is updated daily on week days.
Initial download of the metrics may take a while.