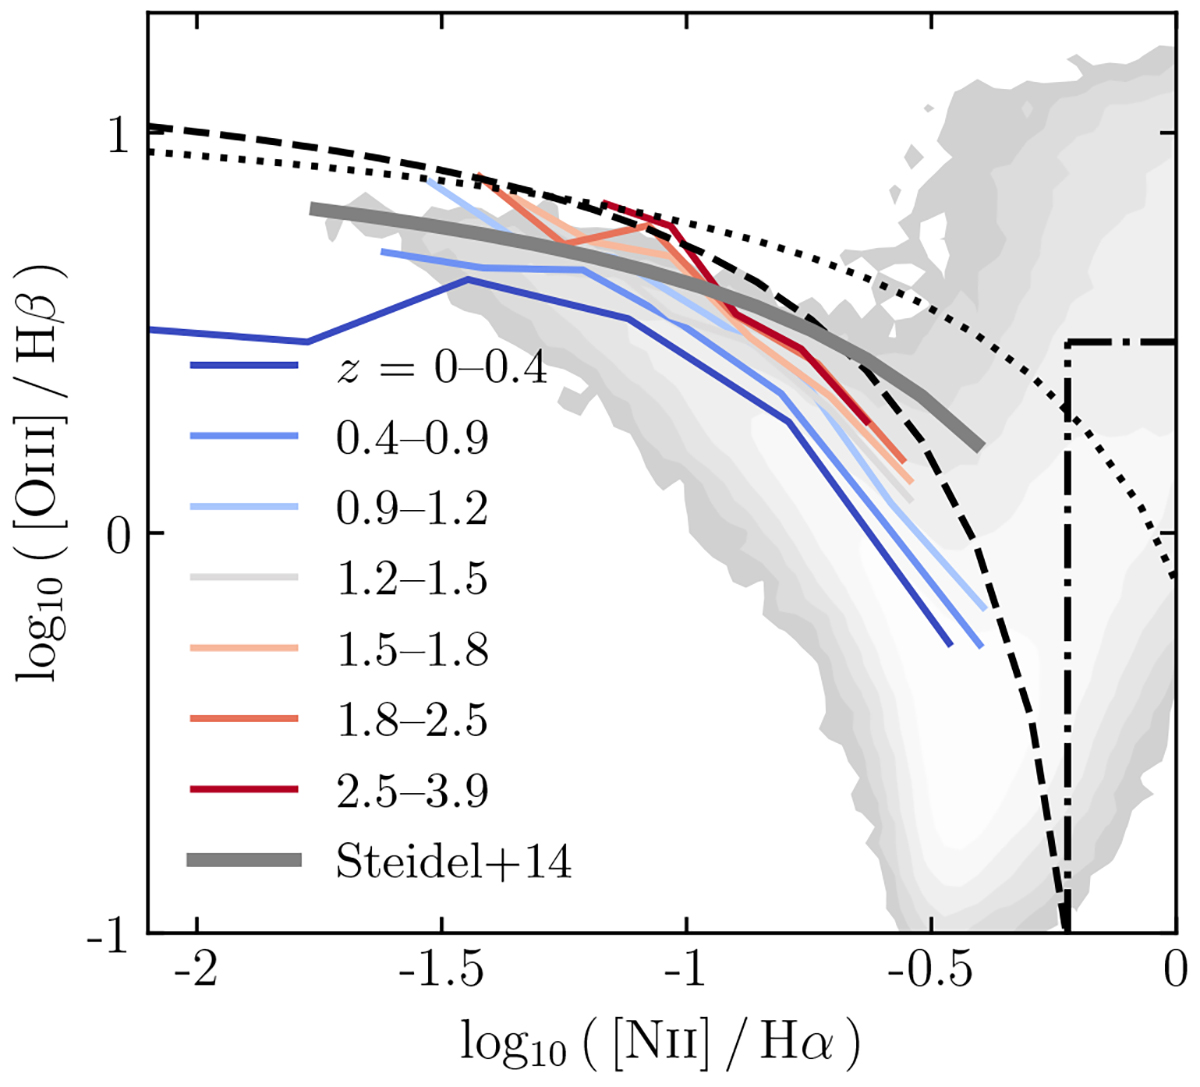
Fig. 4.
Download original image
Evolution of average [O III]/Hβ versus [N II]/Hα of SF-dominated GAEA-LC galaxies at different redshift intervals, as indicated by the legend (coloured lines). Shown are simulated SDSS-like galaxies with masses greater than 109 M⊙. Overplotted is the mean relation found by Steidel et al. (2014) in their sample of star-forming galaxies at redshift 2.3 (thick grey line) and, as in Fig. 3, the SDSS sample (grey contours) and empirical criteria distinguishing between ionising sources (Kewley et al. 2001; Kauffmann et al. 2003, black lines).
Current usage metrics show cumulative count of Article Views (full-text article views including HTML views, PDF and ePub downloads, according to the available data) and Abstracts Views on Vision4Press platform.
Data correspond to usage on the plateform after 2015. The current usage metrics is available 48-96 hours after online publication and is updated daily on week days.
Initial download of the metrics may take a while.