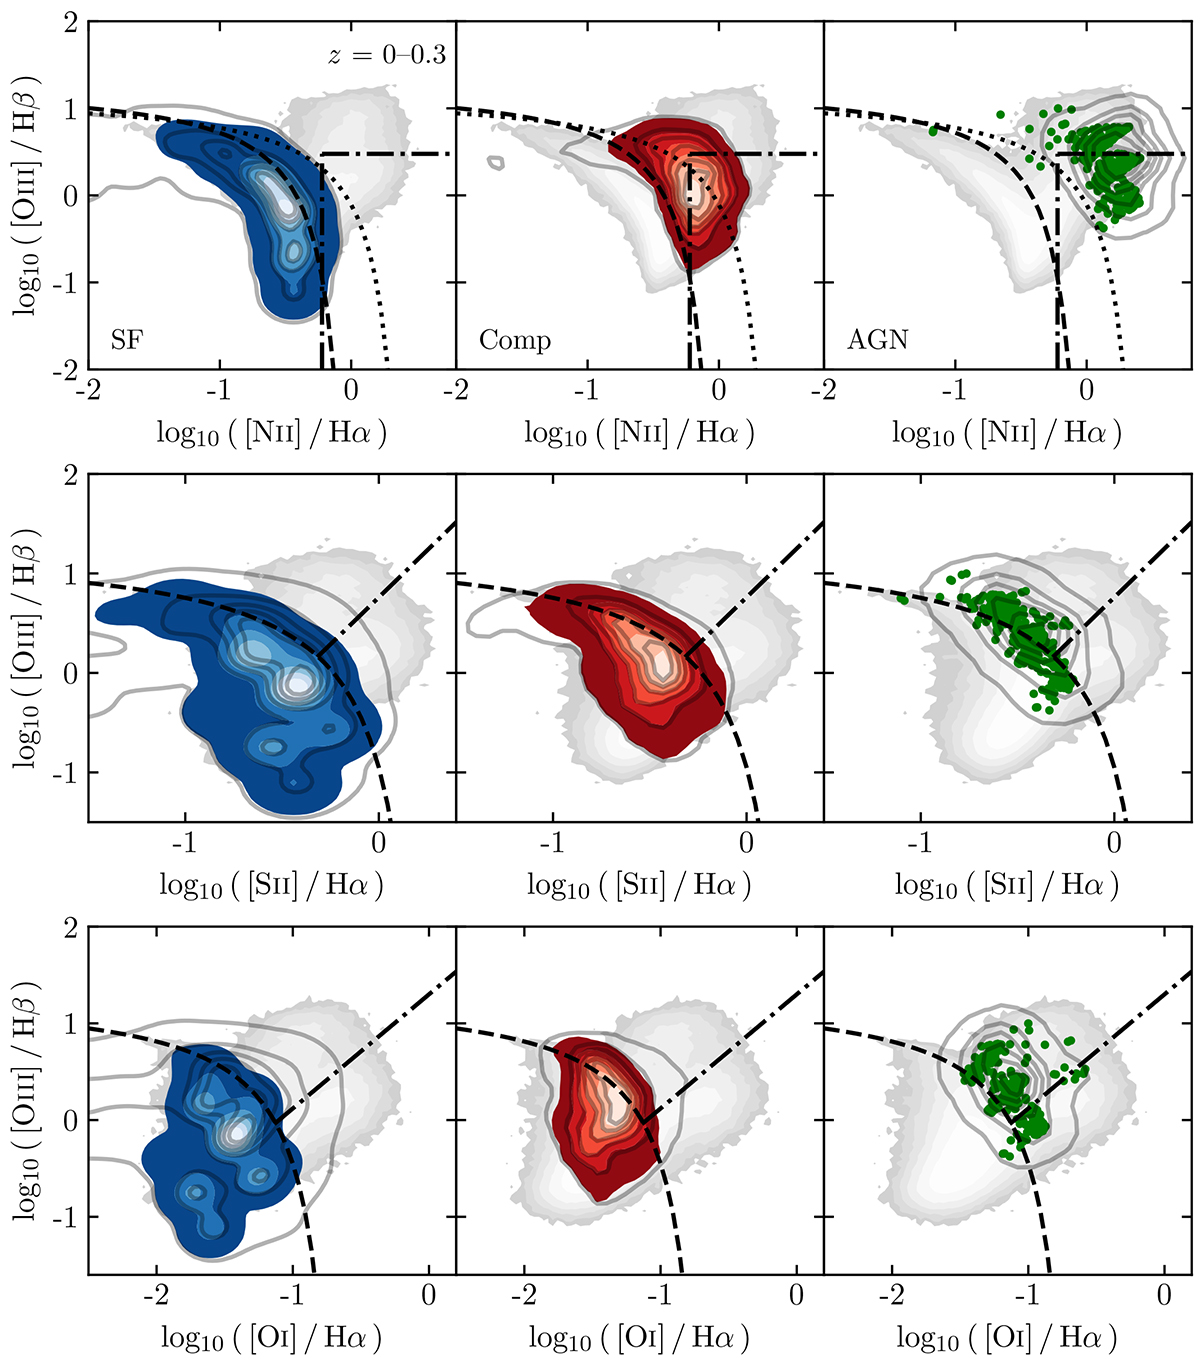
Fig. 3.
Download original image
Location of GAEA-LC galaxy populations at redshift 0–0.3 in the classical BPT diagrams, [O III]/Hβ versus [N II]/Hα (top row), [O III]/Hβ versus [S II]/Hα (middle row), and [O III]/Hβ versus [O I]/Hα (bottom row). Shown are simulated SDSS-like galaxies (limited to fluxes above 5 × 10⁻¹⁷ erg s−1 cm−2, coloured contours and data points), alongside the intrinsic GAEA-LC sample (grey contour lines). For comparison, SDSS-observed galaxies are plotted in the background (filled grey contours). Galaxy populations are divided according to dominant ionising source, meaning SF-dominated galaxies (blue, left column), composite galaxies (red, middle column), and AGN-dominated galaxies (green, right column). Overplotted are empirical selection criteria meant to broadly distinguish SF galaxies (below dashed lines, Kewley et al. 2001 in top row, Kauffmann et al. 2003 in middle and bottom row) and active galaxies (above dashed lines). An additional criterion separates composite galaxies (above dashed line and below dotted line, Kewley et al. 2001) from purely AGN-dominated galaxies in the [O III]/Hβ versus [N II]/Hα diagram. In all diagrams, LI(N)ER are expected to fall in the bottom right corner (rectangle defined by dash-dotted lines in top row, Kauffmann et al. 2003 and area below dash-dotted lines in middle and bottom row Kewley et al. 2006).
Current usage metrics show cumulative count of Article Views (full-text article views including HTML views, PDF and ePub downloads, according to the available data) and Abstracts Views on Vision4Press platform.
Data correspond to usage on the plateform after 2015. The current usage metrics is available 48-96 hours after online publication and is updated daily on week days.
Initial download of the metrics may take a while.