Fig. 2.
Download original image
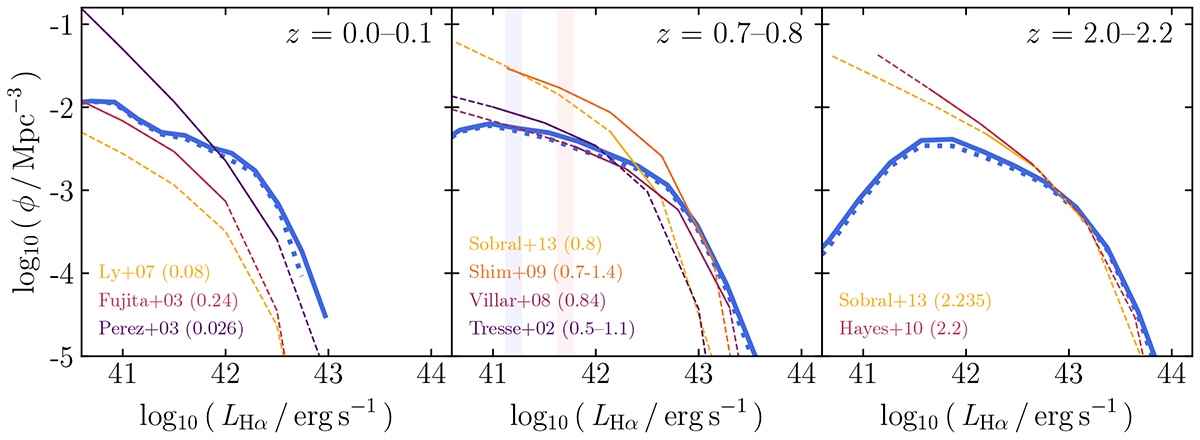
Redshift evolution of the Hα luminosity function for all (solid blue lines) and only SF-dominated (dotted blue lines) GAEA-LC galaxy populations from redshift zero to 2.2. Overplotted are various fits to dust-corrected observational results (thin lines) from narrow-band and spectroscopic surveys within the redshift range indicated by the legend in each panel (Tresse et al. 2002; Fujita et al. 2003; Perez-Gonzalez et al. 2003; Ly et al. 2007; Villar et al. 2007; Shim et al. 2009; Hayes et al. 2010; Sobral et al. 2013). Due to selection effects, the resulting Schechter fits rely on measurements covering only part of the luminosity range (solid), which are then extrapolated to low and high luminosities (dashed). For reference, the EWS (red) and EDS (blue) detection limits across the redshift range between 0.7 and 0.8 are shown in shaded areas.
Current usage metrics show cumulative count of Article Views (full-text article views including HTML views, PDF and ePub downloads, according to the available data) and Abstracts Views on Vision4Press platform.
Data correspond to usage on the plateform after 2015. The current usage metrics is available 48-96 hours after online publication and is updated daily on week days.
Initial download of the metrics may take a while.