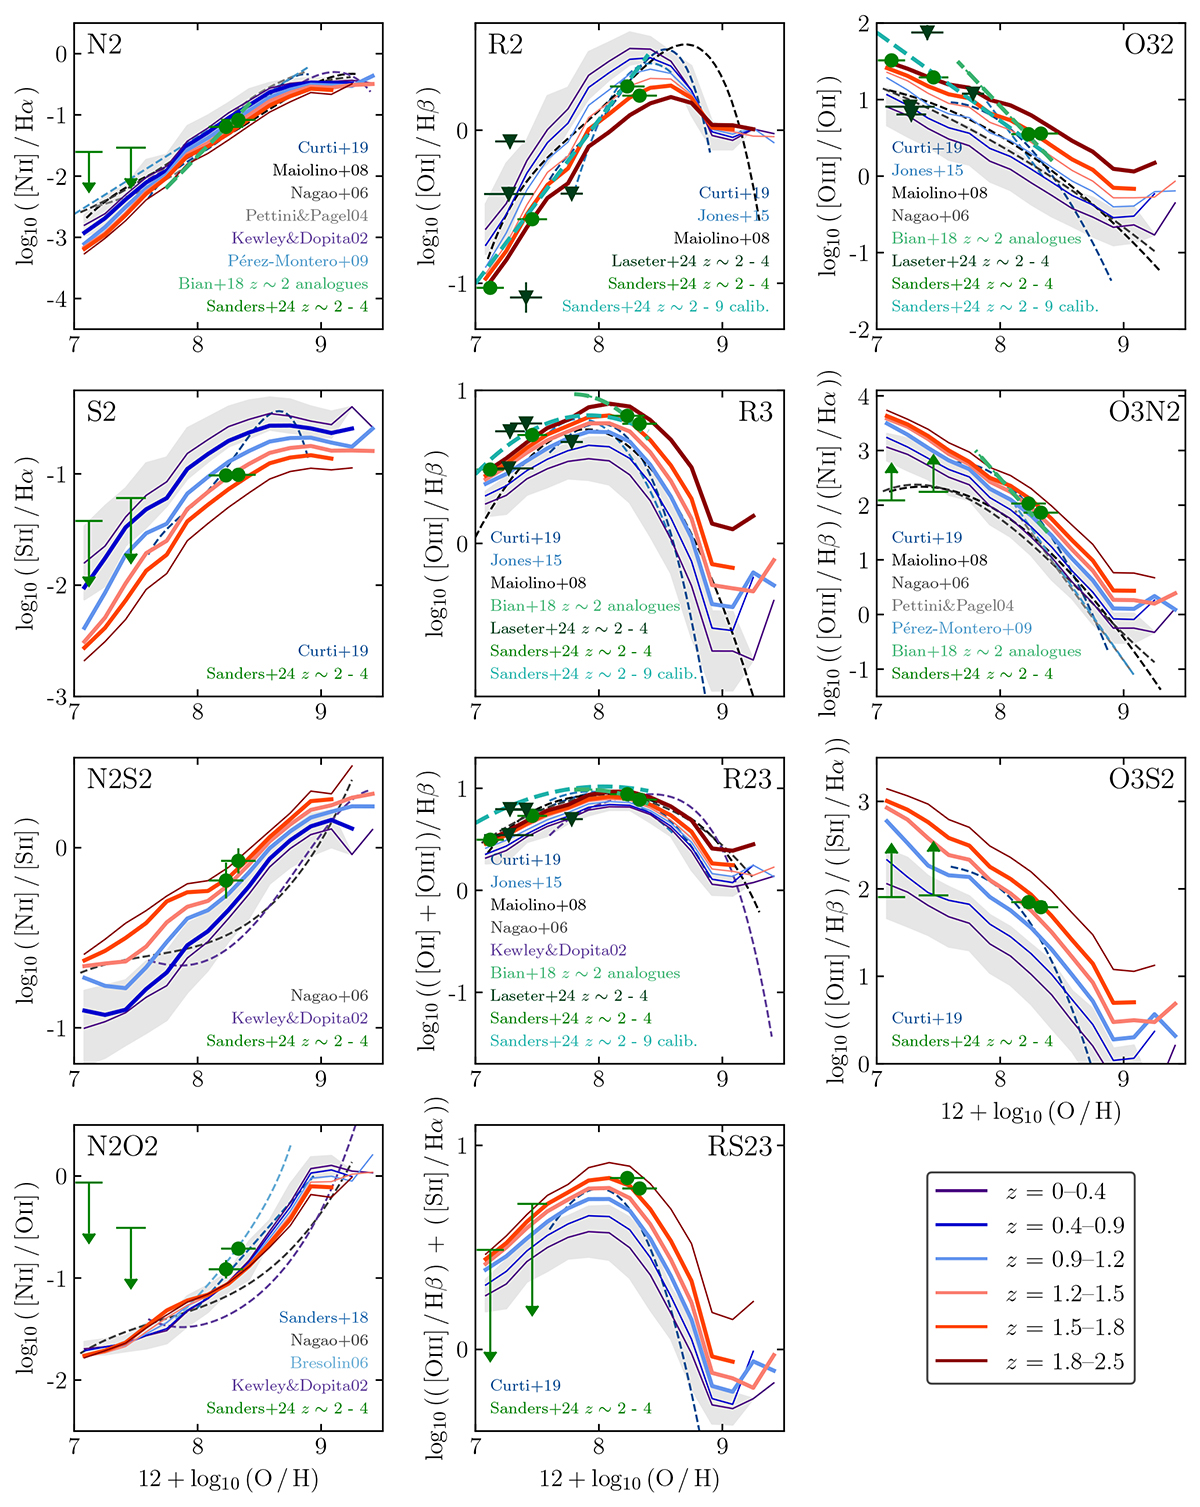
Fig. 15.
Download original image
Average ratios of strong emission lines against interstellar O/H abundance. We consider in the left column: N2, [S II]/Hα (hereafter S2), N2S2, and N2O2; in the middle column: [O II]/Hα (R2), [O III]/Hα (R3), [(O III] + [O II])/Hα (R23), and ([O III/Hα) + ([S II/Hα) (RS23); and in the right column: [O III]/[O II] (O32), ([O III]/Hα)/([N II]/Hα) (O3N2), and ([O III]/Hα)/([S II]/Hα) (O3S2). Solid lines show each relation for the GAEA-LC SF-dominated populations in different redshift bins, using the same colours as in Fig. 14, with thick lines indicating overlap of the relevant emission lines with the EDS sensitivity range. Overplotted are empirical and theoretical calibrations at redshift zero (blue and purple dashed lines, respectively; grey indicates calibrations using a combination of both; Curti et al. 2019; Jones et al. 2015; Pérez-Montero & Contini 2009; Bresolin 2006b; Tremonti et al. 2004; Kewley & Dopita 2002; Marino et al. 2013; Maiolino et al. 2008; Nagao et al. 2006; Pettini & Pagel 2004). Additionally shown are recent estimates for higher redshifts (green dashed lines and data points Bian et al. 2018; Sanders et al. 2024; Laseter et al. 2024).
Current usage metrics show cumulative count of Article Views (full-text article views including HTML views, PDF and ePub downloads, according to the available data) and Abstracts Views on Vision4Press platform.
Data correspond to usage on the plateform after 2015. The current usage metrics is available 48-96 hours after online publication and is updated daily on week days.
Initial download of the metrics may take a while.