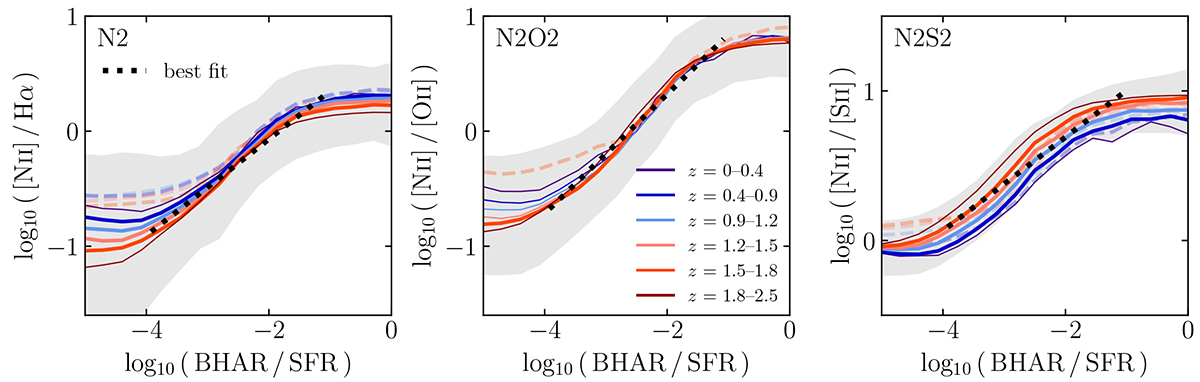
Fig. 14.
Download original image
Average ratios of [N II]/Hα (left panel), [N II][O II] (middle panel), and [N II][S II] (right panel) versus BHAR/SFR in different redshift intervals (same key as in Fig. 12, with an additional redshift 0–0.4 line in indigo). Overplotted are the best linear fits between −4 ≤ log10(BHAR/SFR)≤ − 1 (dotted lines). Respectively shown for N2, N2O2, and N2S2 are the 2, 1.5, and 1σ scatter of the entire 0–2.5 redshift range, which each encompass the 12 + log10(O/H) = 8 − 9 range (grey shaded area).
Current usage metrics show cumulative count of Article Views (full-text article views including HTML views, PDF and ePub downloads, according to the available data) and Abstracts Views on Vision4Press platform.
Data correspond to usage on the plateform after 2015. The current usage metrics is available 48-96 hours after online publication and is updated daily on week days.
Initial download of the metrics may take a while.