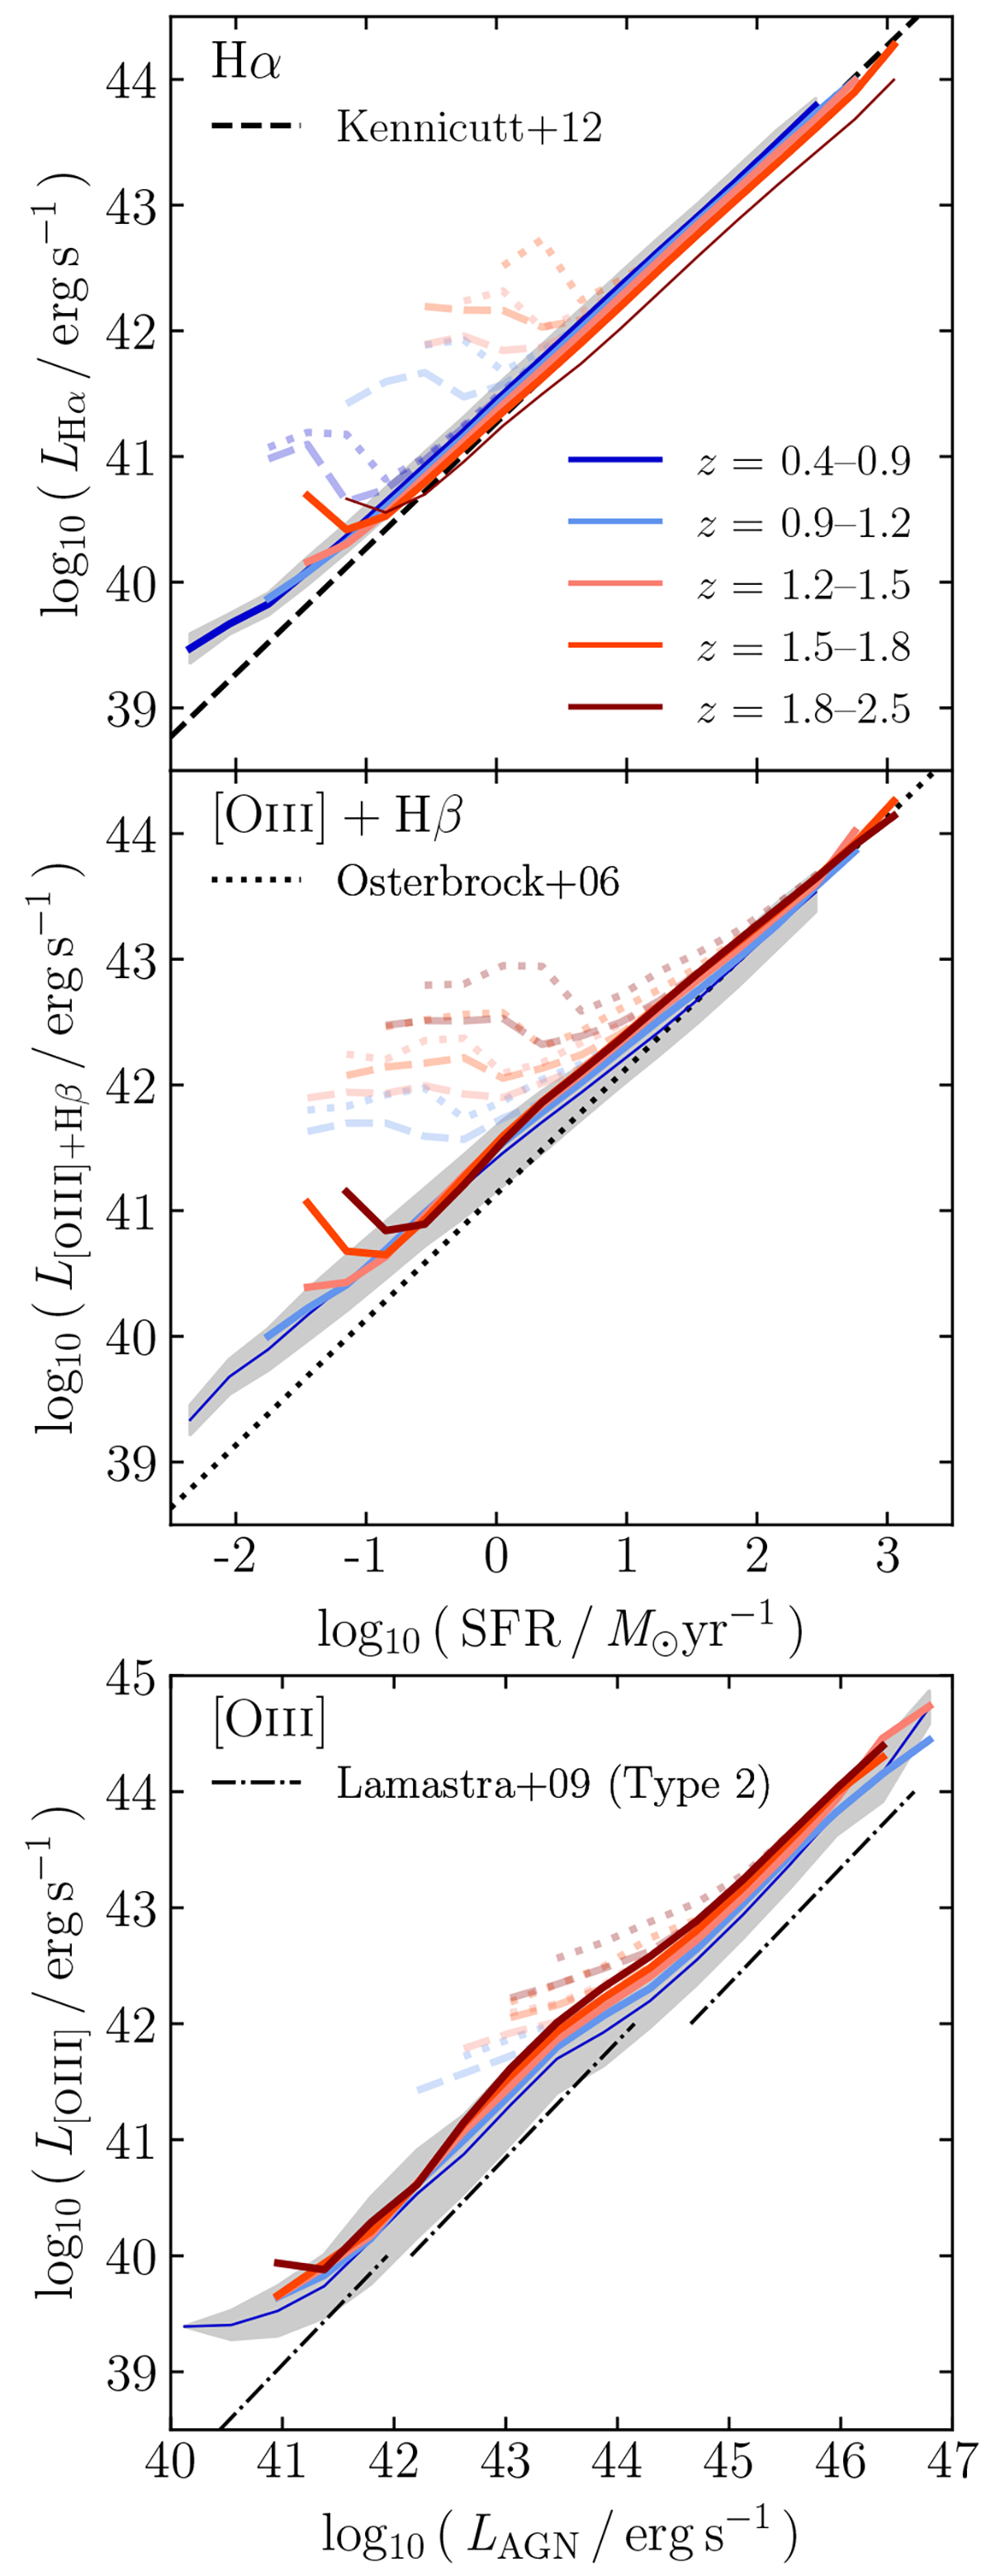
Fig. 12.
Download original image
Average Hα (top panel) and [O III] + Hβ (middle panel) line luminosities versus the SFR for GAEA-LC star-forming galaxies in different redshift intervals (shown in different coloured solid lines as indicated by the legend). For completeness, the three relations are shown for the same redshift intervals, but thick lines indicate that the emission line is within the EDS wavelength sensitivity range. For those, the flux-limited (dashed lines) and dust-attenuated relations (dotted lines) are plotted in fainter colours. As in Fig. 5, predictions are compared to local calibrations (Kennicutt & Evans 2012; Osterbrock & Ferland 2006). In the bottom panel, the average [O III] line luminosity is plotted against AGN luminosity for active GAEA-LC galaxies and the relation found by Lamastra et al. (2009, dash-dotted). The coloured lines for different redshift bins follow the same key as above.
Current usage metrics show cumulative count of Article Views (full-text article views including HTML views, PDF and ePub downloads, according to the available data) and Abstracts Views on Vision4Press platform.
Data correspond to usage on the plateform after 2015. The current usage metrics is available 48-96 hours after online publication and is updated daily on week days.
Initial download of the metrics may take a while.