Fig. 11.
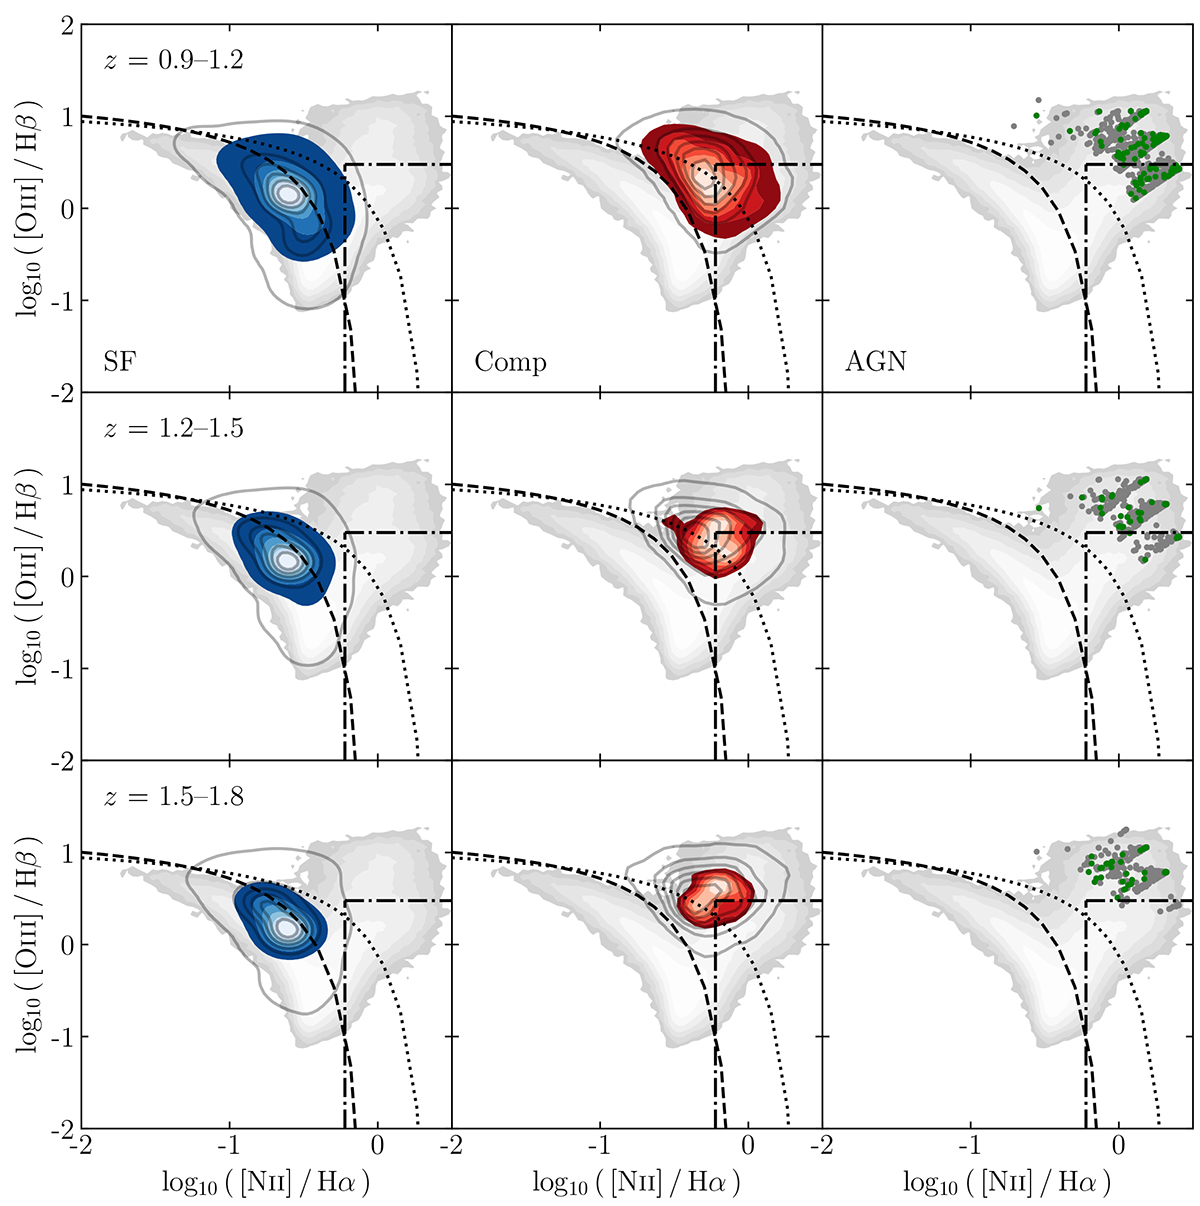
Download original image
Location of EDS-observable GAEA-LC galaxy populations in the [O III]/Hβ versus [N II]/Hα BPT diagram, divided into redshift bins 0.9–1.2 (top row), 1.2–1.5 (middle row), and 1.5–1.8 (bottom row). Shown are the flux-limited (grey contour lines and data points) and dust-attenuated samples (coloured contours and data points). The columns and colour coding for different dominant ionising sources, the empirical selection criteria to distinguish between them and the SDSS-observed galaxies, shown for comparison, follow the same layout as Fig. 3.
Current usage metrics show cumulative count of Article Views (full-text article views including HTML views, PDF and ePub downloads, according to the available data) and Abstracts Views on Vision4Press platform.
Data correspond to usage on the plateform after 2015. The current usage metrics is available 48-96 hours after online publication and is updated daily on week days.
Initial download of the metrics may take a while.