Fig. 1.
Download original image
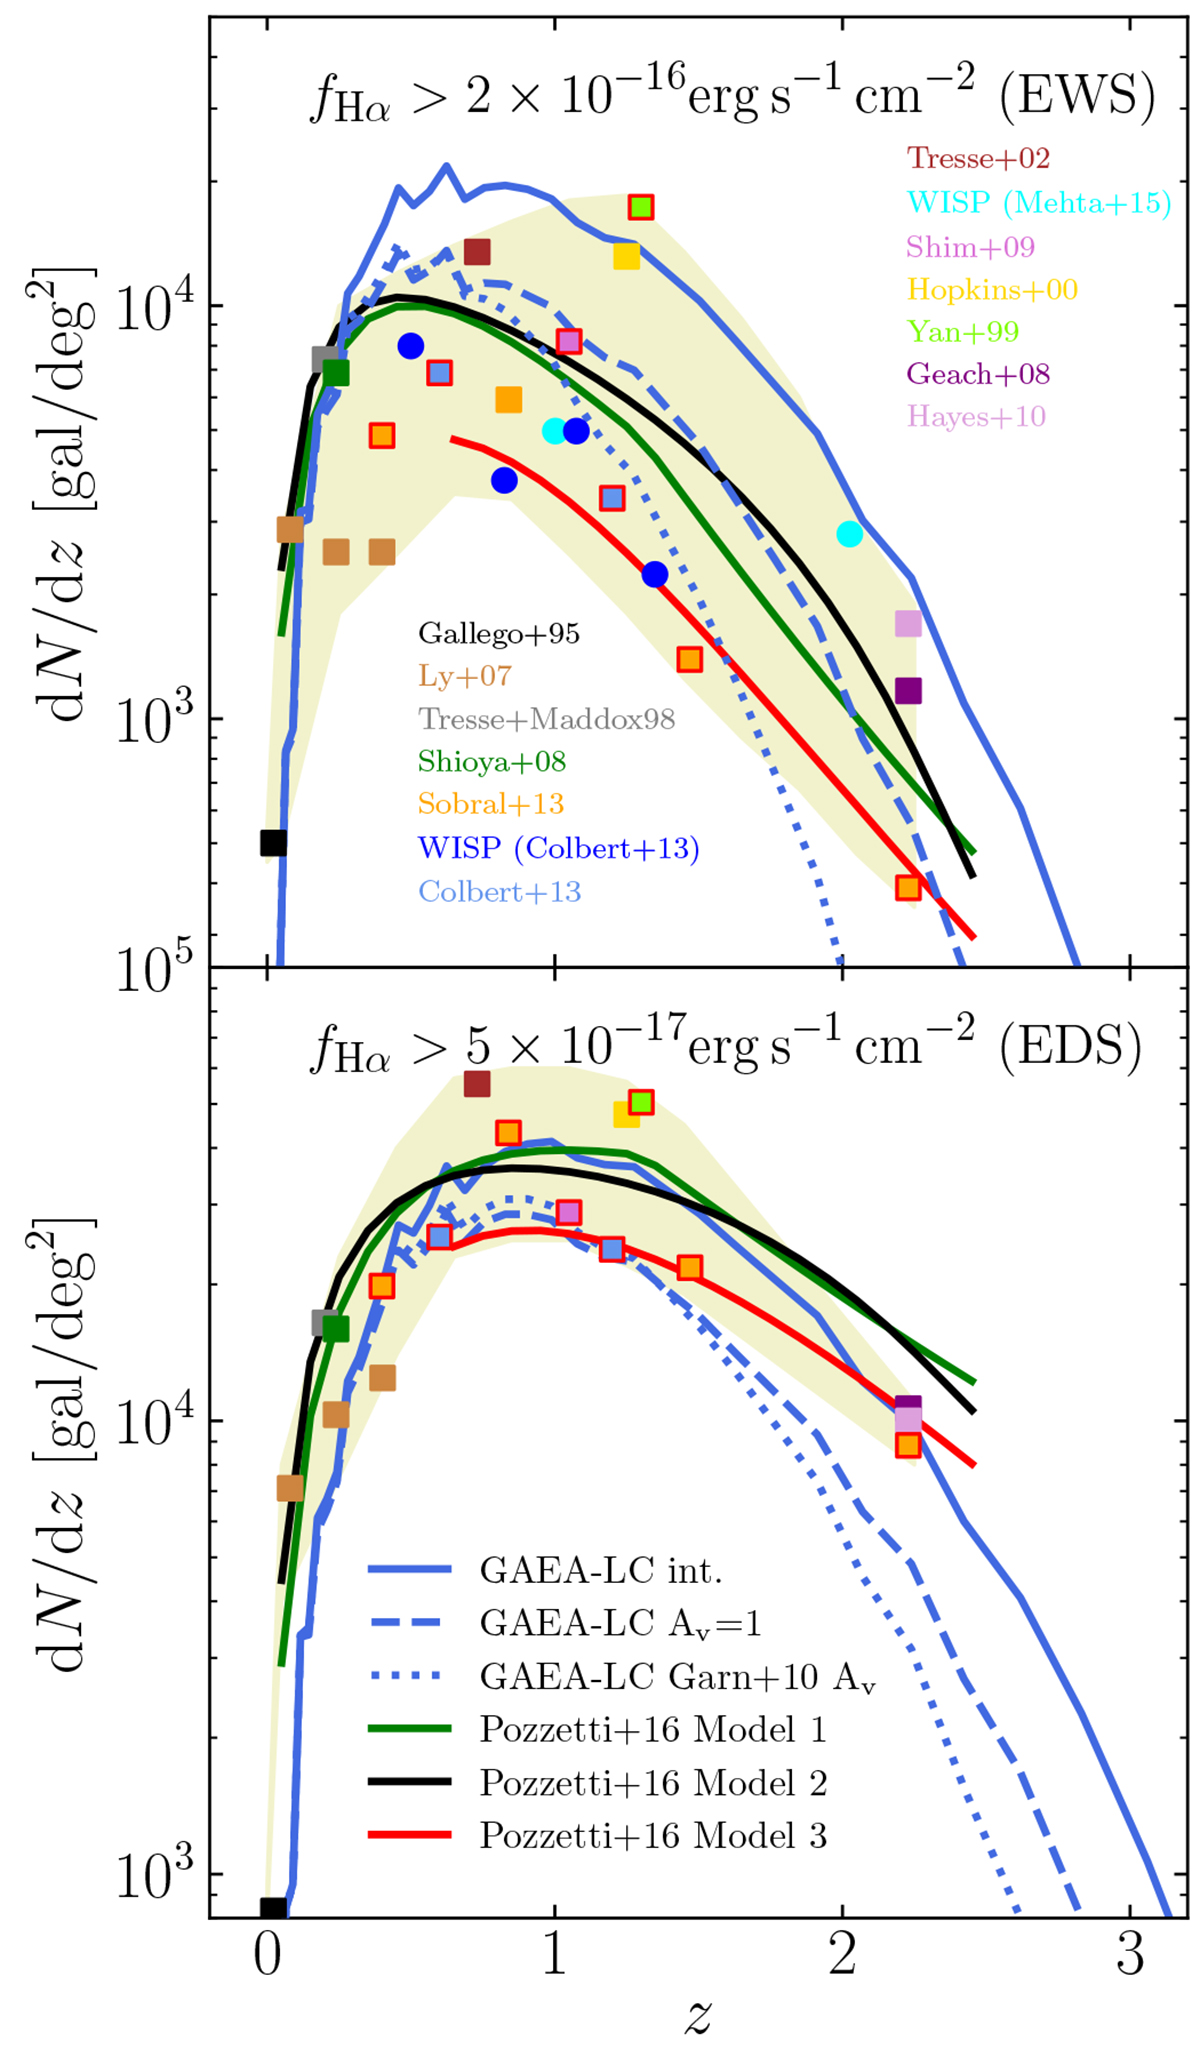
Redshift distribution of the number density of Hα emitters above flux thresholds 2 × 10⁻¹⁶ erg s−1 cm−2 (top panel) and 5 × 10⁻¹⁷ erg s−1 cm−2 (bottom panel), corresponding to the respective EWS and EDS flux limits. Predictions from the GAEA-LC framework (blue lines) use the intrinsic population of emitters (solid) and dust-attenuated versions with a flat Av (dashed) and a mass-dependent Av scaling (dotted Garn & Best 2010). Models 1 (green), 2 (black), and 3 (red) from Pozzetti et al. (2016) represent various model fits to collections of uncorrected Hα survey results (data points, covering yellow-shaded area) across different redshift ranges. Model 3 has been fit to data points outlined in red.
Current usage metrics show cumulative count of Article Views (full-text article views including HTML views, PDF and ePub downloads, according to the available data) and Abstracts Views on Vision4Press platform.
Data correspond to usage on the plateform after 2015. The current usage metrics is available 48-96 hours after online publication and is updated daily on week days.
Initial download of the metrics may take a while.