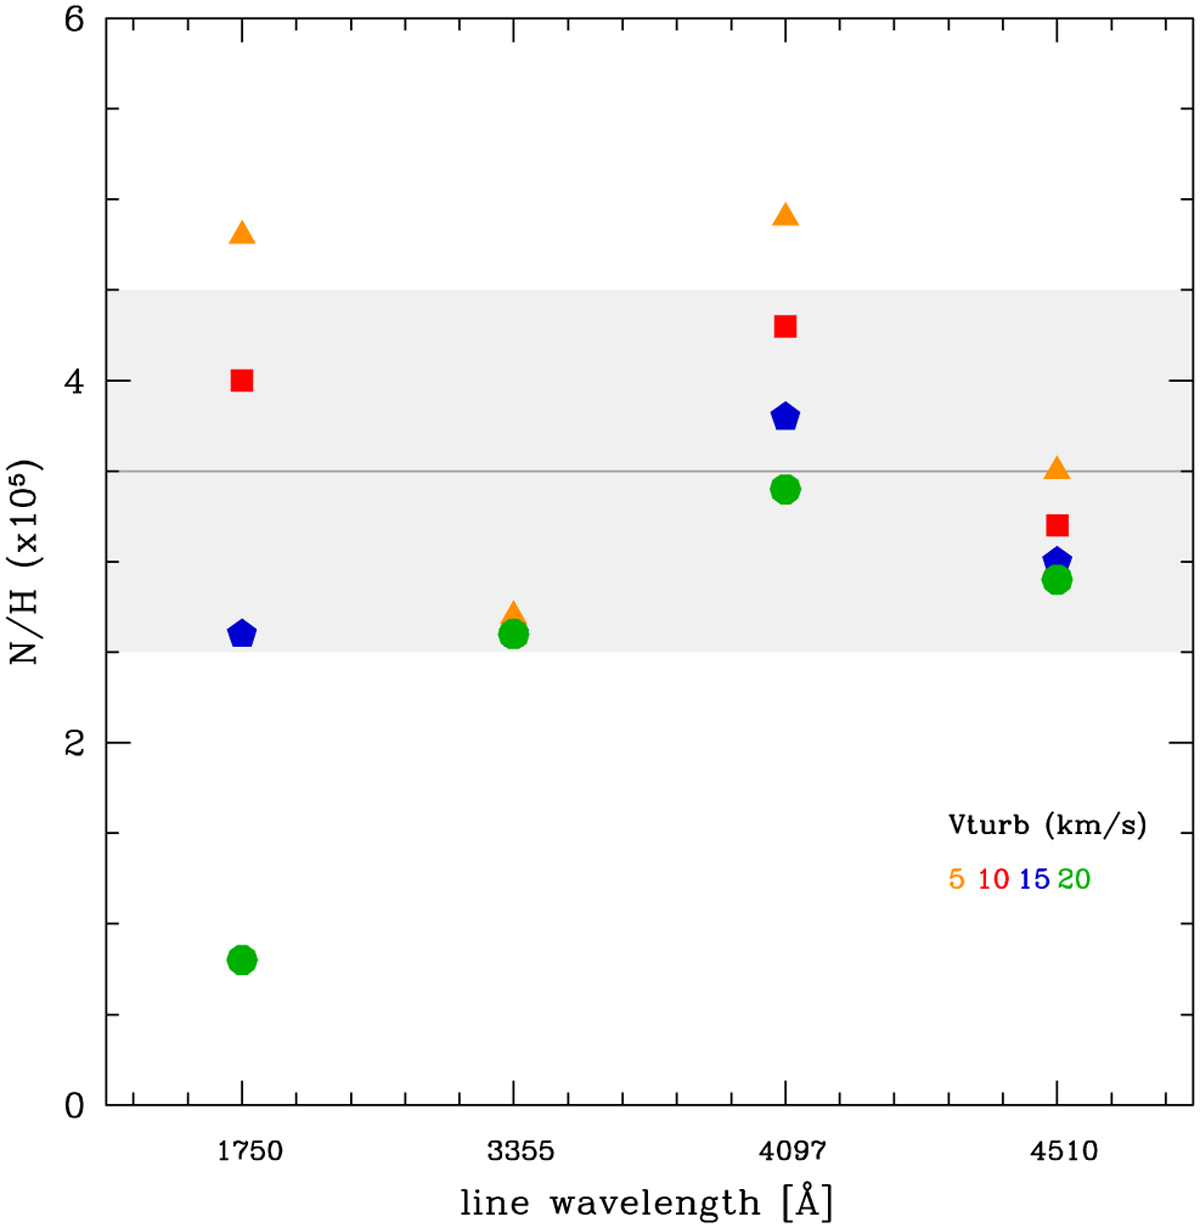
Fig. 2
Download original image
Example of determination of the nitrogen abundance and vtrub for star AV47. The horizontal axis shows the wavelengths of the different nitrogen lines used, labelled by their wavelength. The vertical axis gives the best fitting abundance (N/H by number) for each line. Different symbols and colours correspond to different microturbulent velocities. All points for line N III 3355 overlap. The grey line and area highlight the final abundance value and its uncertainty. See text for discussion.
Current usage metrics show cumulative count of Article Views (full-text article views including HTML views, PDF and ePub downloads, according to the available data) and Abstracts Views on Vision4Press platform.
Data correspond to usage on the plateform after 2015. The current usage metrics is available 48-96 hours after online publication and is updated daily on week days.
Initial download of the metrics may take a while.