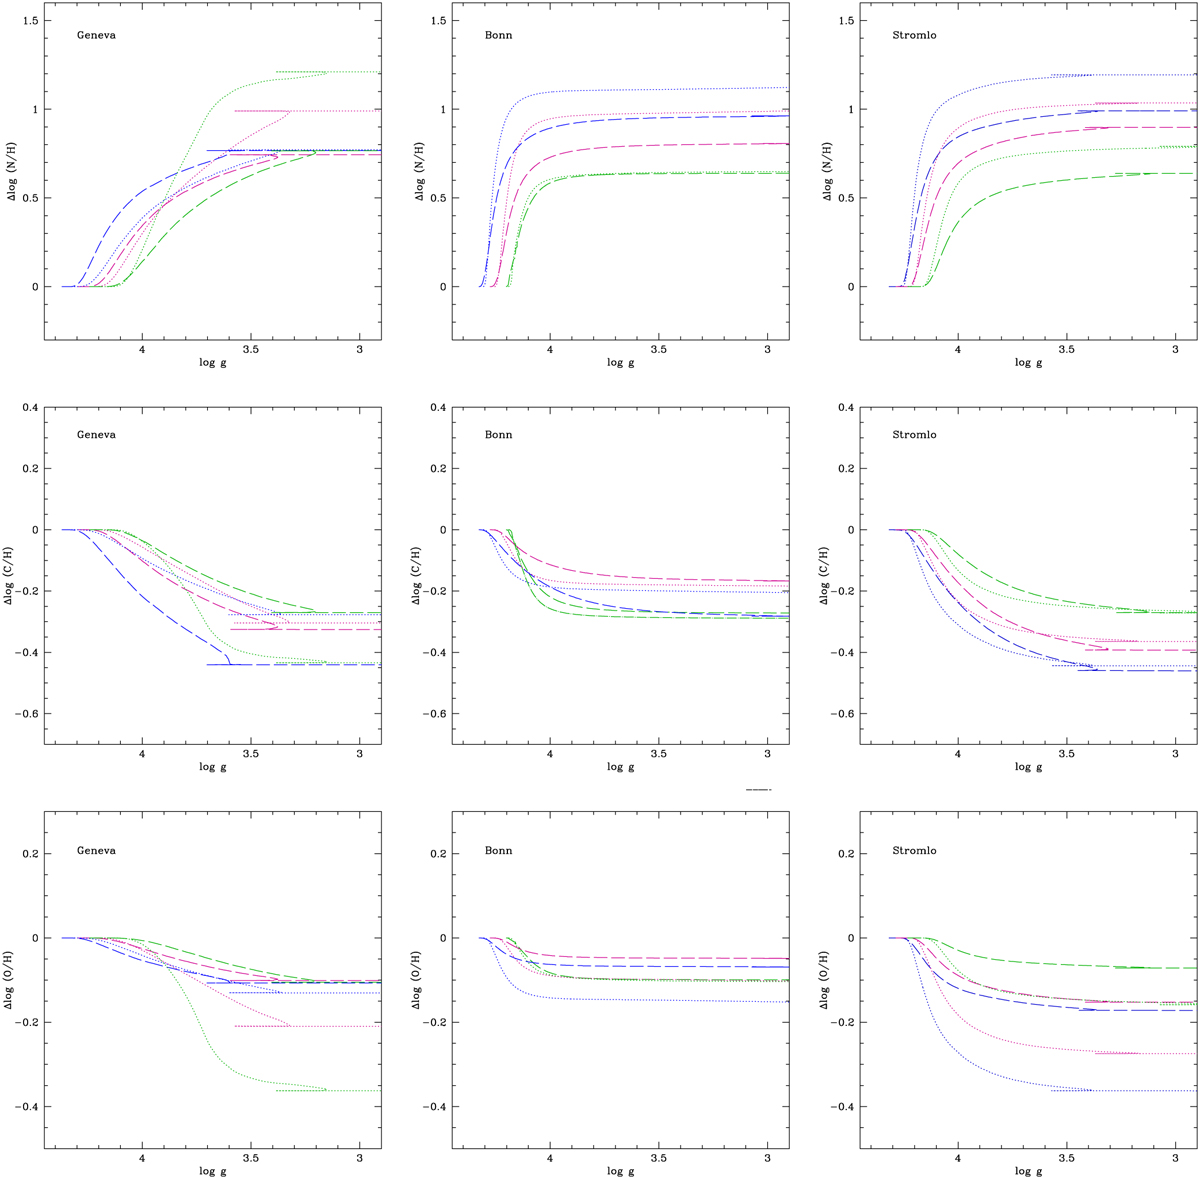
Fig. C.1
Download original image
Difference between present and initial surface abundance as a function of surface gravity. Top, middle, and bottom rows show differences in nitrogen, carbon, and oxygen abundances respectively. The Geneva, Bonn, and Stromlo models are shown in the left, middle, and right column respectively. For each set of models the 25 and 40 M⊙ tracks are shown by the dashed and dotted lines respectively. Green, magenta, and blue lines correspond to Galactic, LMC, and SMC chemical composition.
Current usage metrics show cumulative count of Article Views (full-text article views including HTML views, PDF and ePub downloads, according to the available data) and Abstracts Views on Vision4Press platform.
Data correspond to usage on the plateform after 2015. The current usage metrics is available 48-96 hours after online publication and is updated daily on week days.
Initial download of the metrics may take a while.