Open Access
Fig. 1
Download original image
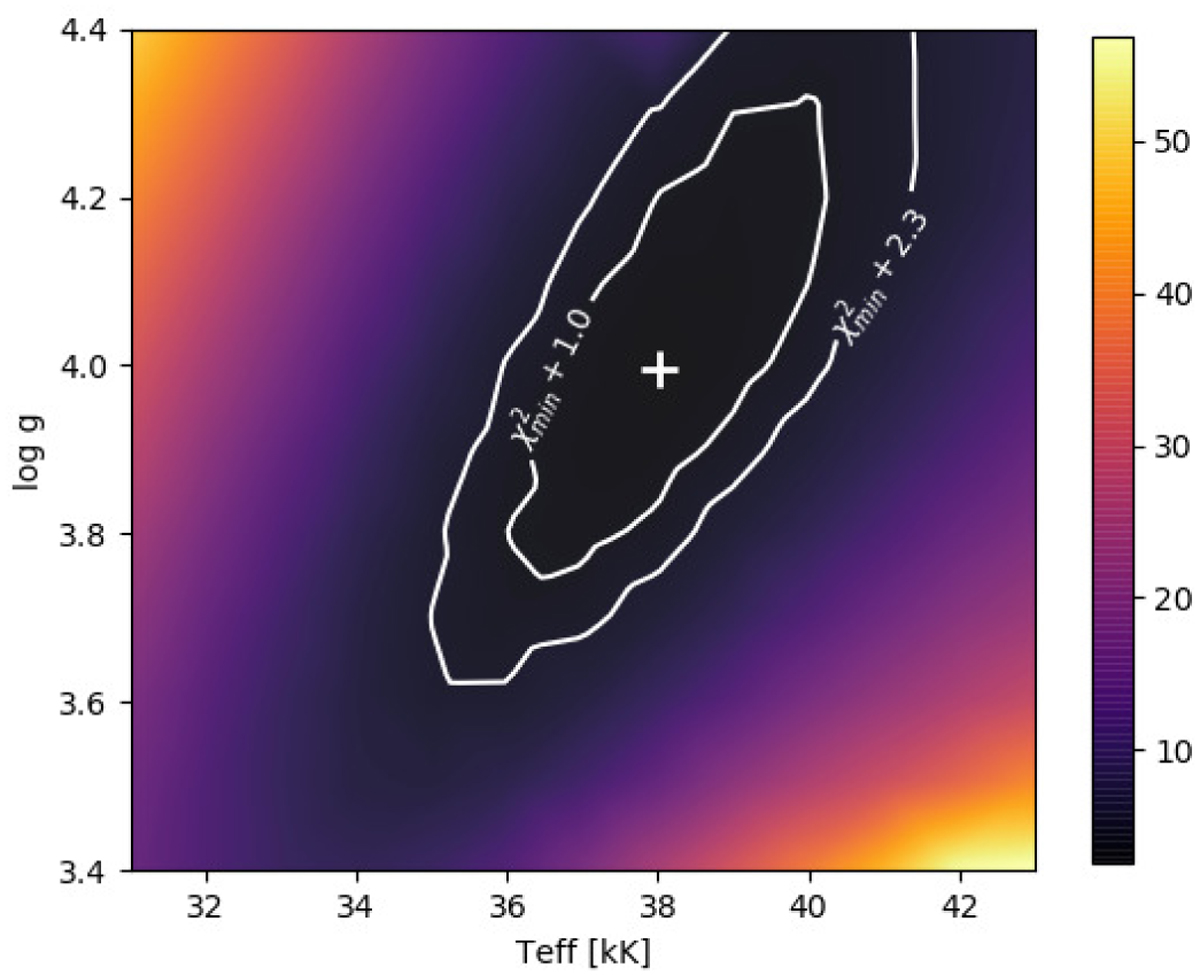
Example of determination of Teff and log g for star AV207 in the SMC. The colour scale indicates the value of the χ2 function. The 1 and 2.3 σ contours are shown by the white lines. The white cross marks the minimum of the χ2 function.
Current usage metrics show cumulative count of Article Views (full-text article views including HTML views, PDF and ePub downloads, according to the available data) and Abstracts Views on Vision4Press platform.
Data correspond to usage on the plateform after 2015. The current usage metrics is available 48-96 hours after online publication and is updated daily on week days.
Initial download of the metrics may take a while.