Open Access
Fig. 9
Download original image
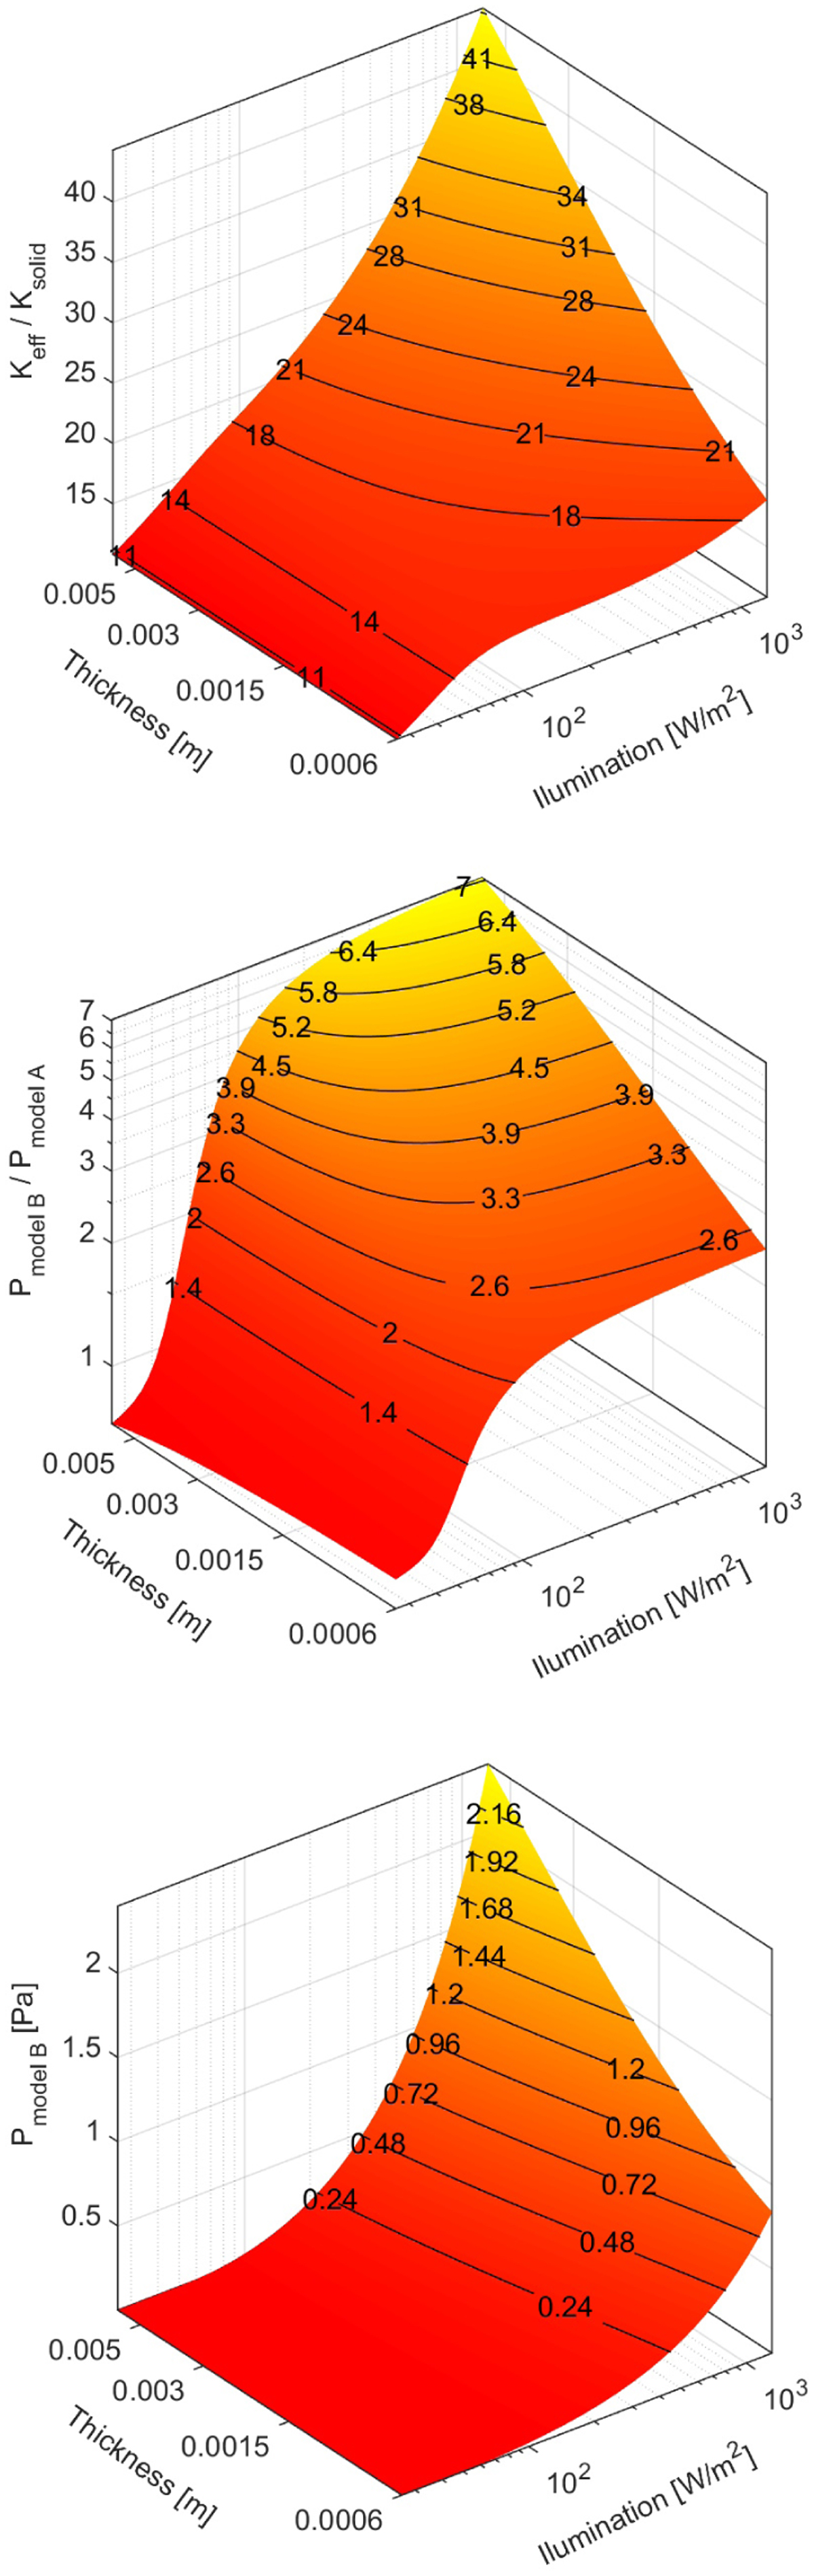
Results for the layer built from large aggregates. Here, we show the ratio of conductivities (top panel), the ratio of the pressures in models B and A (middle panel), and the pressure below the dust crust (bottom panel) as a function of the absorbed energy and the layer thickness.
Current usage metrics show cumulative count of Article Views (full-text article views including HTML views, PDF and ePub downloads, according to the available data) and Abstracts Views on Vision4Press platform.
Data correspond to usage on the plateform after 2015. The current usage metrics is available 48-96 hours after online publication and is updated daily on week days.
Initial download of the metrics may take a while.