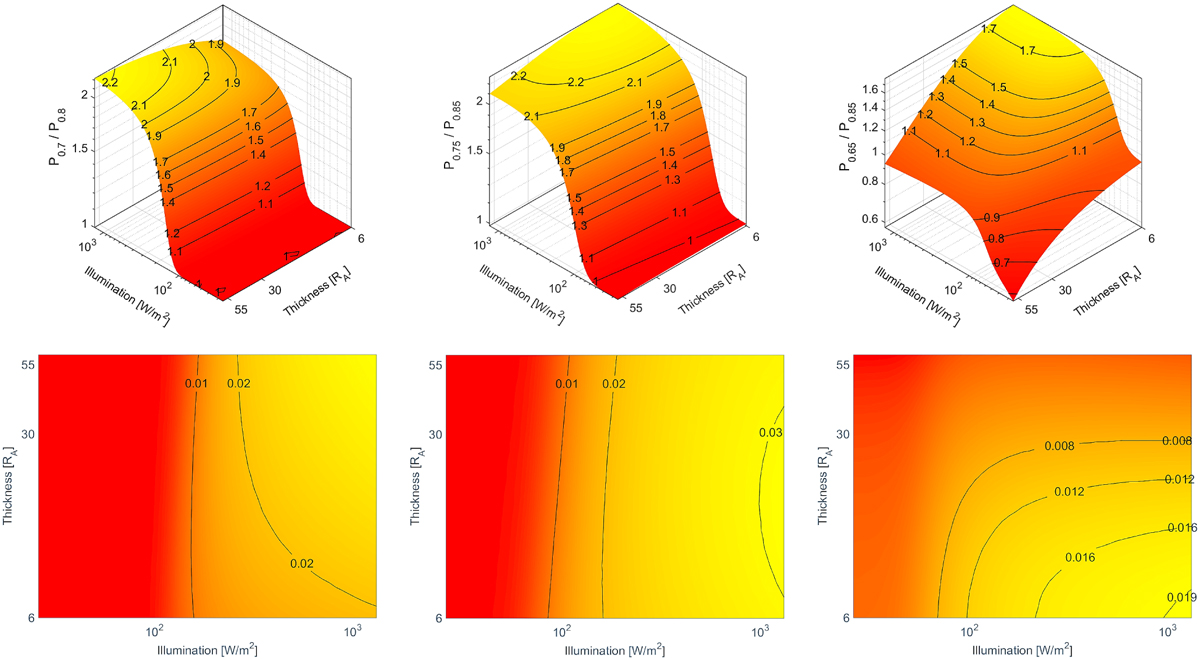
Fig. 8
Download original image
Impact of layer porosity on both temperature and pressure beneath the layer as a function of absorbed energy and layer thickness. The relative increase in temperature is displayed in the left column. The corresponding pressure ratio is presented in the right column. The layers are made up of monomers (top), small aggregates (middle), and large aggregates (bottom). See main text for details.
Current usage metrics show cumulative count of Article Views (full-text article views including HTML views, PDF and ePub downloads, according to the available data) and Abstracts Views on Vision4Press platform.
Data correspond to usage on the plateform after 2015. The current usage metrics is available 48-96 hours after online publication and is updated daily on week days.
Initial download of the metrics may take a while.