Fig. 7
Download original image
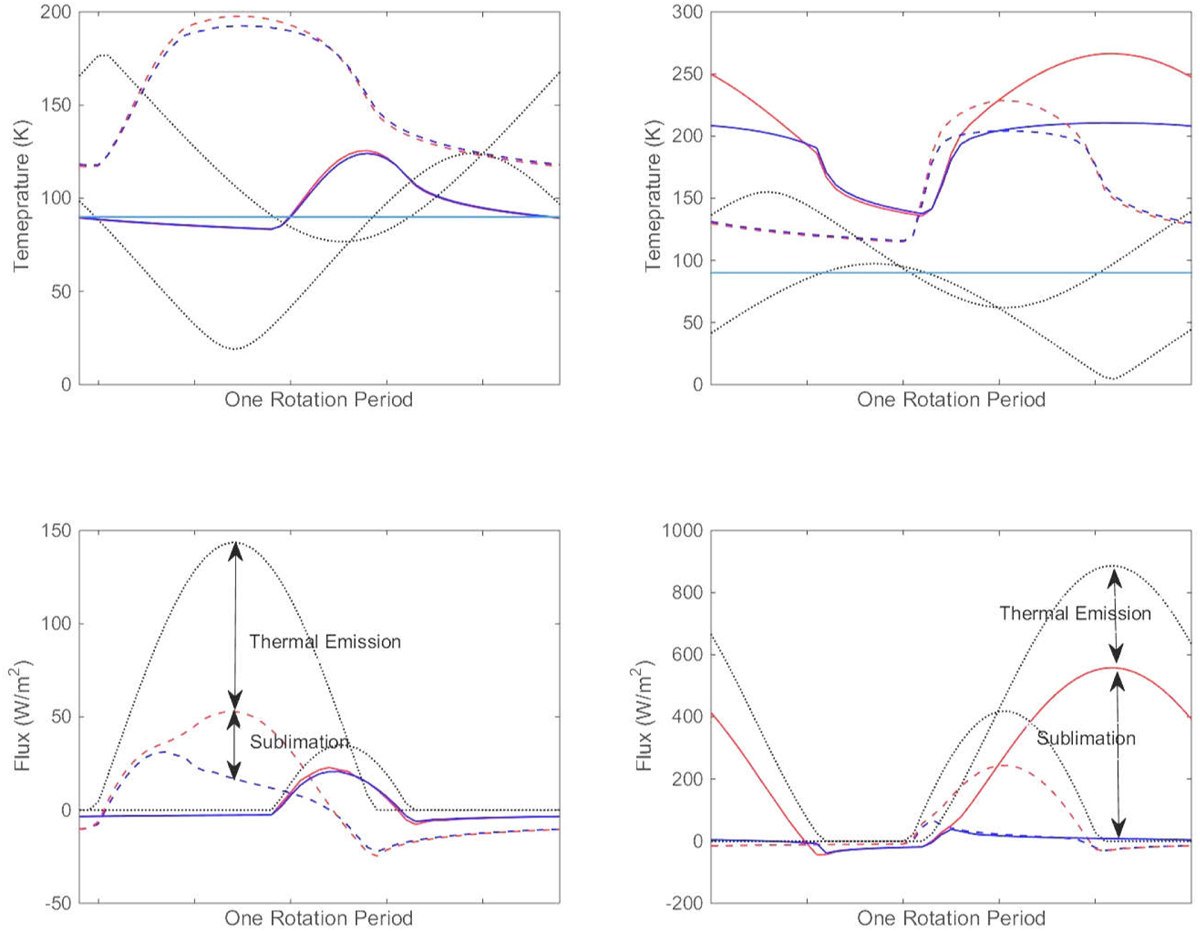
Temperatures (top row) and energy fluxes (bottom row) as a function of time for points 1 and 2. The results are presented for distances of 3 au and 1.24 au in the left column and in the right column, respectively. The illumination functions are shown in Fig. 6. The upper row illustrates the temperature changes at the surface (red curves) and at the lower boundary of the dust layer (blue curves) during one rotation for the two selected points (dashed curves for Point 1 and solid curves for Point 2). The corresponding solar zenith angle is represented by thin dotted curves. The lower row plots the energy flows: total absorbed energy (dotted curves), and heat flux at both the surface (red curves) and the lower boundary of the dust layer (blue curves).
Current usage metrics show cumulative count of Article Views (full-text article views including HTML views, PDF and ePub downloads, according to the available data) and Abstracts Views on Vision4Press platform.
Data correspond to usage on the plateform after 2015. The current usage metrics is available 48-96 hours after online publication and is updated daily on week days.
Initial download of the metrics may take a while.