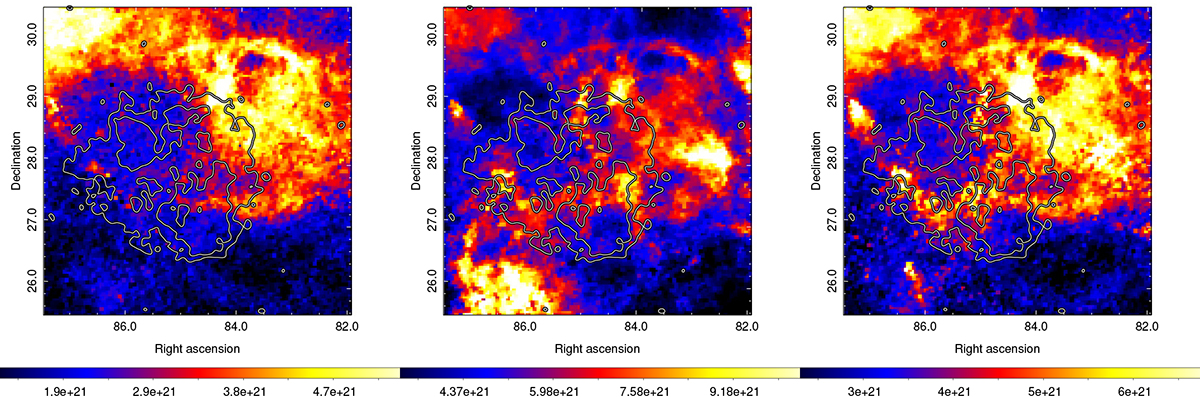
Fig. 9.
Download original image
Hydrogen column-density maps (NH, in units of cm−2) derived by utilizing the DUSTMAPS python package (Green 2018), employing bayestar19 data cubes (Green et al. 2019), and converting the obtained extinction to NH according to Eq. (2) (Foight et al. 2016). Left panel: NH map until a 0.6 kpc distance. Middle panel: NH map until 1.9 kpc distance. Right panel: NH map until 1.33 kpc distance (preferred distance of the SNR given the distance measurements of the associated pulsar and the runaway star-binary companion to the pulsar’s progenitor). As shown in Figure 8, the black and white contours represent two levels of eRASS:4 X-ray data in the 0.5–1.0 keV energy band.
Current usage metrics show cumulative count of Article Views (full-text article views including HTML views, PDF and ePub downloads, according to the available data) and Abstracts Views on Vision4Press platform.
Data correspond to usage on the plateform after 2015. The current usage metrics is available 48-96 hours after online publication and is updated daily on week days.
Initial download of the metrics may take a while.