Fig. 8.
Download original image
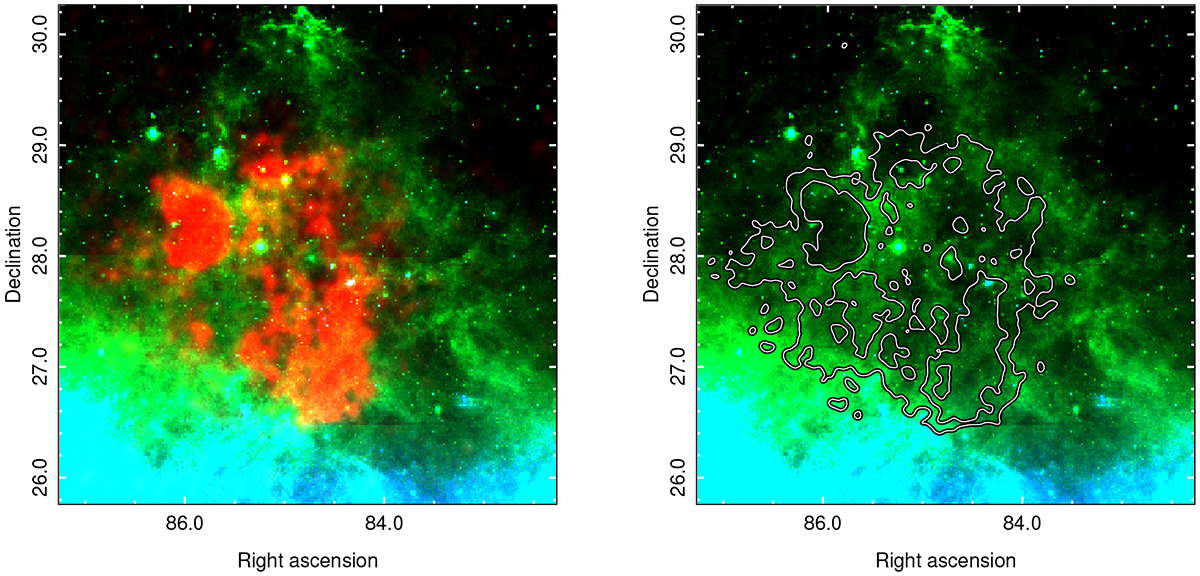
Localized features of spatial anticorrelation between X-ray and infrared emission. Left panel: RGB image, with energy color-coded as follows: eRASS:4 X-ray data in the 0.5–1.0 keV energy band (red), IRAS 25 μm data (green), and IRAS 100 μm data (blue) from the location of S147. Right panel: Combined IRAS 25 μm data (green) and IRAS 100 μm data (blue) from the same location as in the left panel. The black and white contours represent two levels of eRASS:4 X-ray data in the 0.5–1.0 keV energy band, which we overlaid on the IRAS data, aiming to examine potential anticorrelation features between IR and X-ray emission.
Current usage metrics show cumulative count of Article Views (full-text article views including HTML views, PDF and ePub downloads, according to the available data) and Abstracts Views on Vision4Press platform.
Data correspond to usage on the plateform after 2015. The current usage metrics is available 48-96 hours after online publication and is updated daily on week days.
Initial download of the metrics may take a while.