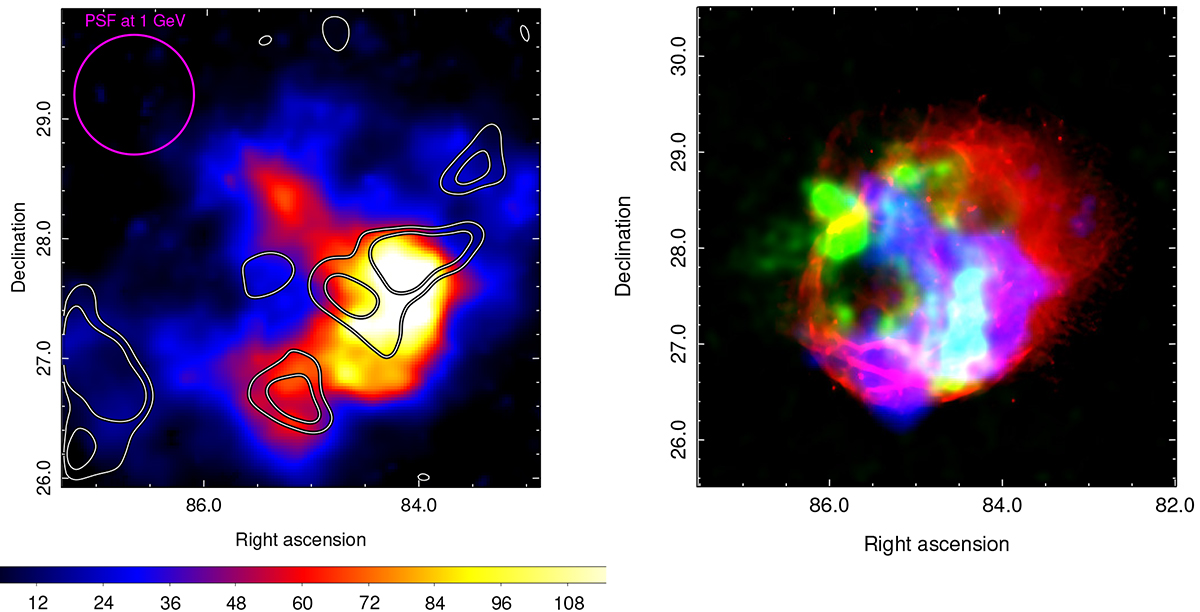
Fig. 6.
Download original image
Refined spatial distribution of γ-ray emission across the remnant’s extension and multiwavelength picture. Left panel: 4° ×4° Fermi-LAT TS map > 1 GeV. The image, of 90″ pixels, is convolved with a σ = 1.5′ Gaussian. The thick magenta circle represents the 68% containment PSF size, derived at the 1 GeV energy threshold used for the construction of the TS map. The black and white contours represent the location of CO clouds (CO Galactic Plane survey data; Dame et al. 2001) likely interacting with the SNR. Right panel: Combined CGPS data at 1.42 GHz (red), 0.5–1.0 keV eRASS:4 data (green), and Fermi-LAT data > 1 GeV (blue) from the location of the remnant.
Current usage metrics show cumulative count of Article Views (full-text article views including HTML views, PDF and ePub downloads, according to the available data) and Abstracts Views on Vision4Press platform.
Data correspond to usage on the plateform after 2015. The current usage metrics is available 48-96 hours after online publication and is updated daily on week days.
Initial download of the metrics may take a while.