Fig. 5.
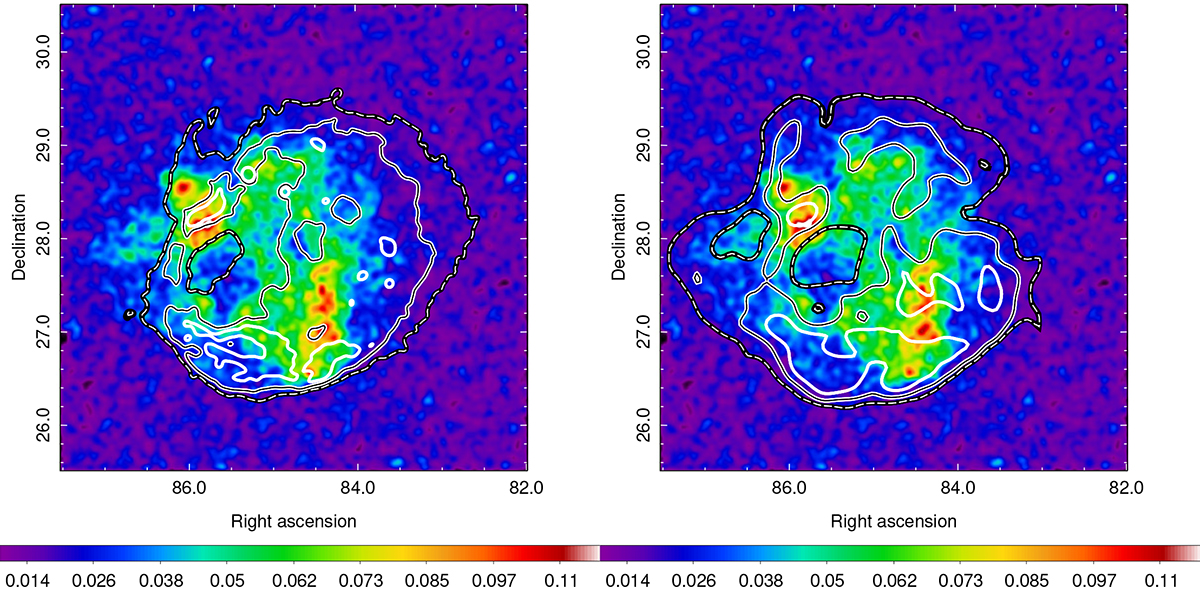
Download original image
eRASS:4 exposure-corrected intensity sky map; the same as the one displayed on the left panel of Fig. 1. Left panel: Canadian Galactic Plane Survey (CGPS) data at 1.42 GHz (Taylor et al. 2003) are overlaid as contours. Right panel: Optical Hα data obtained from the full-sky Hα map of 6′ FWHM resolution (Finkbeiner 2003) are overlaid as contours. For both panels, three level contours are used from thin, dashed, white-on-thick-solid-black, to thin, solid black on thick solid white, and solid white to represent fainter-to-brighter emission regions.
Current usage metrics show cumulative count of Article Views (full-text article views including HTML views, PDF and ePub downloads, according to the available data) and Abstracts Views on Vision4Press platform.
Data correspond to usage on the plateform after 2015. The current usage metrics is available 48-96 hours after online publication and is updated daily on week days.
Initial download of the metrics may take a while.