Fig. 3.
Download original image
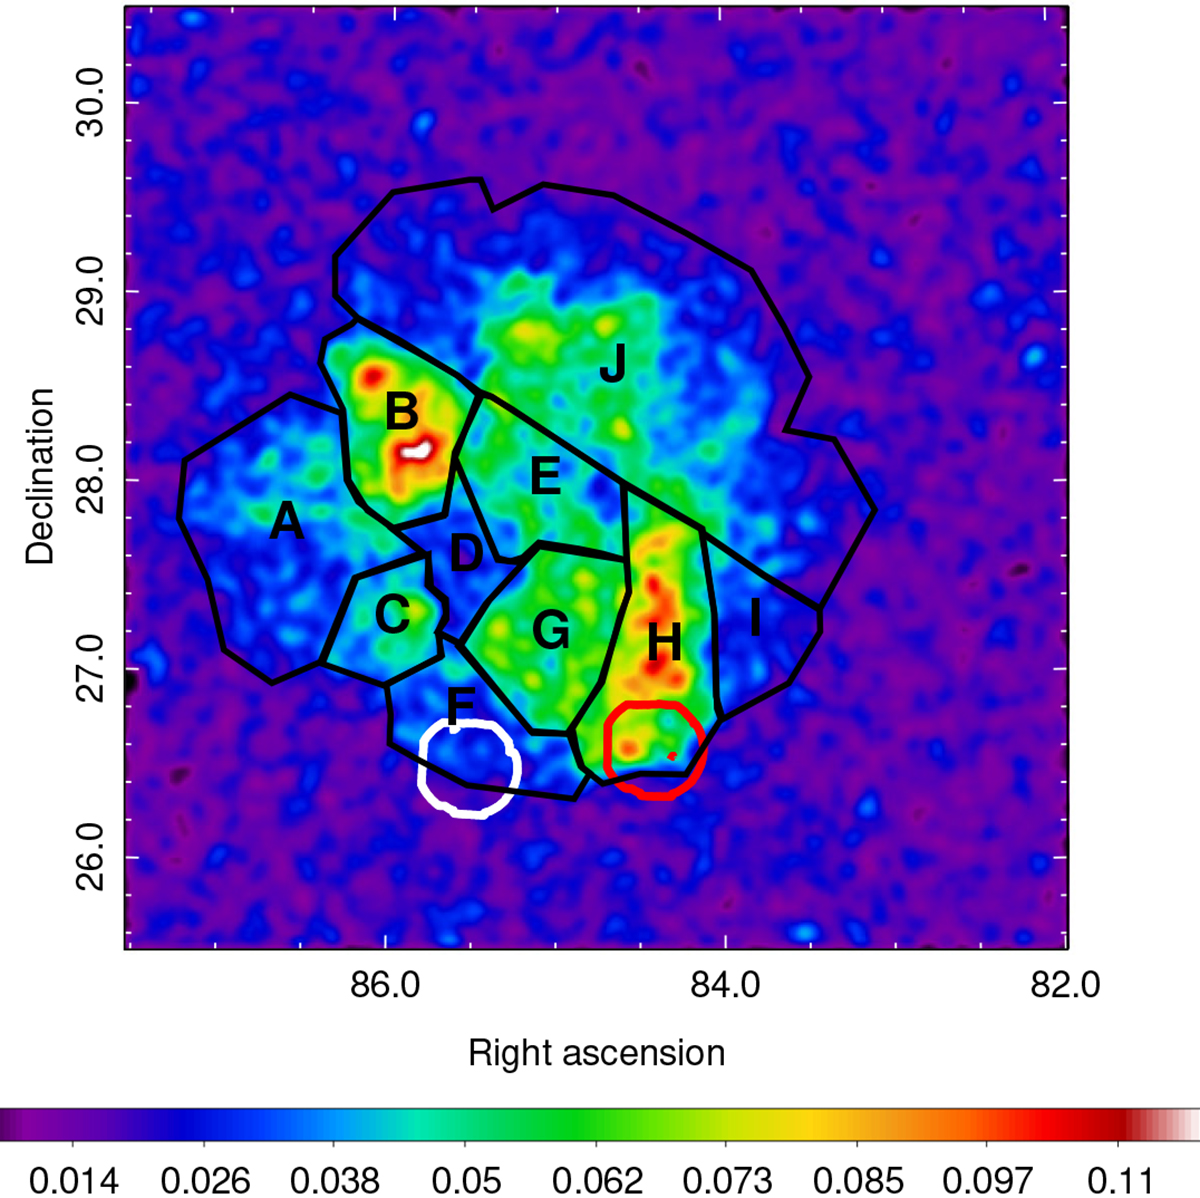
Same image as in Fig. 1 (with identical features in terms of smoothing and point-source removal) depicting the intensity variation across the remnant. The ten distinct subregions selected for further spectral analysis are highlighted as black regions. The entire remnant’s spectrum was obtained from the large polygonal shape region formed when combining all ten individual subregions. White and red contours mark the positions of 0693270301 and 0693270401 XMM-Newton pointings (shown in Fig. 4), respectively.
Current usage metrics show cumulative count of Article Views (full-text article views including HTML views, PDF and ePub downloads, according to the available data) and Abstracts Views on Vision4Press platform.
Data correspond to usage on the plateform after 2015. The current usage metrics is available 48-96 hours after online publication and is updated daily on week days.
Initial download of the metrics may take a while.